Access to foreign exchange trading has opened up exciting trading options for the retail trader. You can now trade alongside corporations and institutions in a highly liquid market that is global, traded around the clock, and highly leveraged. Before jumping into this market, however, we must understand the factors that affect the forex market. With that in mind, STOCKS& COMMODITIES has introduced Forex Focus to better prepare the retail trader to participate in the currency market.
This simple trading system was applied successfully to forex pairs using the moving average convergence/divergence. See if it'll work for you.
by Alexander Sabodin
Today, we see advertisements of different automatic trading systems at numerous websites and forums. If we took those ads seriously, all we would have to do is click the mouse and money would pour into our pockets. Not only that, such black boxes usually don't come cheap. Keeping all that in mind, let's try to create our own trading system. As long as you don't lay claim to the holy grail, a trading system can help you make that trade.
THE MACD TRADING SYSTEM
To build our own trading system, we will use the following indicators:
- Bollinger Bands: Period 20, deviations 2, shift 0, apply to close.
- MACD: Fast exponential moving averages (Ema) 12, slow Ema26, apply to close.
- Stochastic oscillator: %K period 5, %D period 3, slowing 3, price field close/close.
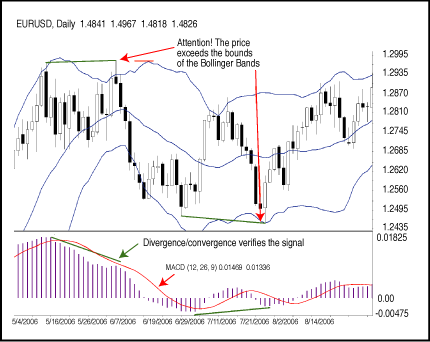
FIGURE 1: GETTING THE GREEN LIGHT. Here, the price exceeds the Bollinger Band and there is an MACD divergence.Let's start with Bollinger Bands. When you apply this indicator, you'll note that prices are between the upper and lower lines 90% of the time. Correspondingly, when the price gets beyond the scope, there's 90% confidence that it'll return inside the lines. In any case, if the price reaches the upper line, the potential of its going down is higher. If it gets to the lower line, its potential for going up is higher. I think of the Bollinger Bands as a yellow signal light that says "Steady!" The indicator certainly gives us leading signals, but if it's the only indicator you use, you may make your entry and exit decisions in a haste.
STOCKS & COMMODITIES magazine. All rights reserved. © Copyright 2008, Technical Analysis, Inc.
Return to March 2008 Contents