Are We Tilting At Windmills?
The Quest For Reliable Crossovers
Moving average crossovers should be reliable and they need to have minimal lag. Here's a technique to achieve it.
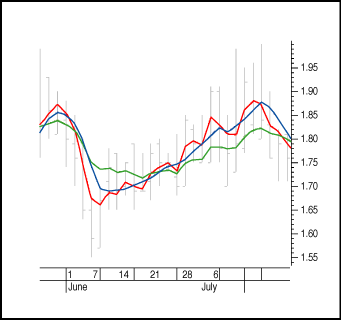
Generally, it's a contradiction to have a smooth reliable moving average crossover on one side while having a fast reaction to price turning points on the other. "Faster" normally refers to shorter moving averages, but that in turn will result in more choppy moves, creating more false buy and sell signals. So if you want to create fast and reliable crossovers, the first thing you have to look at is a way to smooth closing prices with as little lag as possible. In Figure 1 you can see three different averages on the daily price bars:
- The green line represents the 10-day exponential moving average (EMA). The main disadvantage seems to be that this average lags. It takes a couple of weeks for it to signal a new uptrend.
- The red line represents the 10-day TEMA (triple exponential moving average). You can see that this average responds quickly, but there's not enough smoothing. It's almost as choppy as the closing prices.
- The blue line is a 10-day TEMA based on the heikin-ashi closing prices. It looks good; you can tell that it is fast, and the smoothing is excellent.
TEMA was introduced in Technical Analysis of STOCKS & COMMODITIES in 1994 by Patrick Mulloy. TEMA makes use of a technique from chartist John Wilder Tukey to compensate lagging. The price data is passed through the same filter multiple times and then combined:
A 10-day TEMA on closing prices in the MetaStock formula can be seen in the first sidebar, "TEMA."Tema = 3 * Ema - 3 * Ema(Ema) + Ema(Ema(Ema))

FIGURE 1: THREE DIFFERENT AVERAGES. Here you see the 10-day EMA (green), 10-day TEMA (red), and the 10-day TEMA based on the heikin-ashi closing prices.
...Continued in the May issue of Technical Analysis of STOCKS &
COMMODITIES
Excerpted from an article originally published in the May 2008 issue
of Technical Analysis of
STOCKS & COMMODITIES magazine. All rights reserved. © Copyright
2008, Technical Analysis, Inc.
Return to May 2008 Contents