Automation Vs. The Human Brain
Robotic Trading
What works and what doesn't? Only experience will tell. Find out why you need to constantly modify a trading system so it gives you the results you want.
AT a recent investment trade show I attended, the booths displaying charting software looked nearly identical. High-tech charts blinking red and green had hordes of traders gathered around them. Vendors were proclaiming the age of the emotionless trade, triggered by an automatic buy or sell signal generated by a computer that never makes a mistake. Traders have flocked to these automated trading systems in recent years in a mass frenzy typical of a market boom.
COMPUTERS OR THE HUMAN BRAIN?
Look around you. If these automated trading systems are so perfect, if the computer is better at selecting stocks than a human brain -- the most advanced and complex organism on the planet -- then why aren't those retail traders doing better in the stock market? For that matter, why would large institutional investor and trader firms even need high-salary managers and advisors? Stock prices do not follow a set mathematical process, which is how computers are able to crunch numbers instantaneously and how most automated trading systems function.
Contrary to popular opinion, computers have not gotten any smarter since the day Bill Gates started Microsoft. In fact, computers are only capable of following a set sequential list of commands written by a human brain. And at this point, computers are highly limited to mathematical formulas that follow a rigid set path of instructions.
But that's not how the stock market functions. The stock market is made up of human beings and the results of their decision-making process, emotions and all. The market behaves more like a highly complex biological ecosystem with checks and balances, as well as evolutionary pressures driven by both slow event processes that change the market over time, and sudden event processes that alter the market abruptly and permanently.

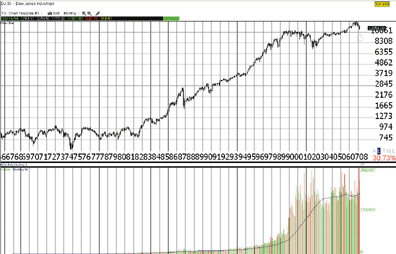
FIGURE 1: DOW JONES INDUSTRIAL AVERAGE. The acceleration of volume really begins in 1998....Continued in the June issue of Technical Analysis of STOCKS & COMMODITIES
Excerpted from an article originally published in the June 2008 issue
of Technical Analysis of
STOCKS & COMMODITIES magazine. All rights reserved. © Copyright
2008, Technical Analysis, Inc.
Return to June 2008 Contents