How To Look At Your Trades
Develop Your Own Market Lens
When do you know it's the right time to buy? When do you know it's the right time to sell? Here's how you can approach these critical decisions.
Buying and selling decisions can plague your thinking. It is only when you put these questions under the lens of why you buy and sell stocks will you get consistent success in making money in the stock market. Here's the foundation for how I approach these critical decisions.
First, how do you deal with the overwhelming amount of information about buying stocks and researching companies in which to invest your money? How do you know what to pay attention to and what to throw away? One major step in my trading occurred when I realized I needed to figure out when it was time to act. Before I even think of putting my money at risk in a stock, I first put it through my own market lens, a specific chart, that I understand. One glance at my market lens and I'll know if I should watch this stock, if I should act right now, or if I should not pay any attention at all.
THE MARKET LENS
As a trader of stocks, we deal with numbers every day. Part of the beauty
of working with numbers is that we can chart daily fluctuations to improve
how we view the price action. That's why charts are prevalent tools for
the pros, and they should be for you too. While it is easy to find software
to chart stock price movements (most online brokers provide fairly decent
charts), it is just as easy to get hung up in the minutiae of charting
and lose sight of why we use charts in the first place. We should use charts
to improve our decisions, not impede them!

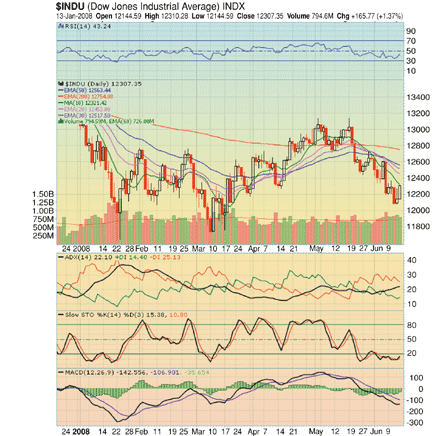
FIGURE 1: TOO MANY INDICATORS. When there are too many indicators on a chart, you don't know where to begin and your trading decisions can often get clouded....Continued in the September issue of Technical Analysis of STOCKS & COMMODITIES
Excerpted from an article originally published in the September 2008 issue of Technical Analysis of STOCKS & COMMODITIES magazine. All rights reserved. © Copyright
2008, Technical Analysis, Inc.
Return to September 2008 Contents