Swing Trading And Market Pace
by Danish Kapur
What do financial markets show? Personally, I don't think they show much besides the way the people associated with them are thinking. And that thinking keeps changing. Sometimes people get fearful and sometimes they get greedy, which is why markets keep moving, frequently making swing highs and swing lows.

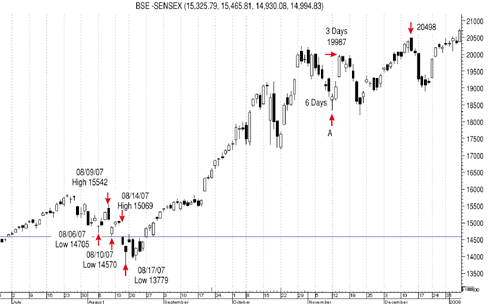
FIGURE 1: THE SENSEX (JULY 2007-DECEMBER 2007). Identifying swing highs and swing lows first and then determining the pace of the market will help you achieve profitability when swing trading.
So financial markets represent the psychology of the people trading the markets. Everything people have on their minds is depicted in the form of the price on charts. Like the saying goes, "Prices discount everything." All technical indicators are derived from price. So we can say that all indicators are based on the psychology of those associated with the markets.
TRADING SWINGS
You just have to take care to limit your loss and profit will take care of itself. This is what I believe, and one of the methods to achieve this is to study price using swing charts along with studying the pace of markets. The study of the pace of the market helps me confirm the turning points in markets.
First of all, let me introduce you to the way I trade using swing charts. There is no hard and fast rule for swing trading, as different methods work for different markets, and the method really lies in observing the market's historical data.
I usually trade the Indian stock markets and follow the Bombay Stock Exchange Sensitive Index (Sensex) or the S&P CNX Nifty, the leading index for large companies on the National Stock Exchange of India. Let's use the Sensex chart in Figure 1 as an example.
On August 6, 2007, the Sensex made a low of 14705. This low was followed by three days of higher highs and higher lows, making a swing high of 15542 on August 9.
I would consider a swing high as relevant if it is made by at least two higher high and higher low bars. But this varies from market to market. For some markets, relevant swing highs or swing lows would be that made by at least three higher highs and higher lows or three lower lows and lower highs, respectively.
The swing low of 14705 was broken on August 10, and hence the downtrend was confirmed. All the long positions should be liquidated at this point and shorts can be opened with a stop at recent swing high (15542).
On August 14, the Sensex makes a swing high of 15069 before breaking the low of 14570 made on August 10. When the low 14570 of August 10 was broken, the stop for short positions was moved to 15069.
The Sensex makes a low at 13779 on August 17 before moving higher. One of the rules that I follow with my swing trading is to never allow the profits to run into losses. So once I have a profit, I move my stop to my cost price.
The question then arises as to how much profit I should consider. I usually follow the 2% rule, which says that once the position moves into a 2% profit, you move the stop to the cost price. But this again depends upon the market you are trading, and through experience you will gain an understanding of the behavior of the market you are trading.
In this case, I would have been stopped out at my cost price but I would not have initiated any long positions unless and until the swing high of 15069 made on August 14 has been crossed. Once crossed, I will initiate a long position with a stop at the recent low of 13779.
Tracking the pace of the market along with swing trading can help confirm trend reversals. One of the things I pay attention to is counting the days (bars) between swing highs and swing lows.
The Sensex makes a bottom at A and bounces back. It took the Sensex just three days to cover the losses of the previous six days, which shows that the uptrend is still very strong. After making a high at 19987, the Sensex starts falling but takes more than three days to fall to the previous low, which indicates that the downtrend does not have enough strength. The chances are favorable for a bounce and hence for initiating longs near the previous bottom. As you can see, longs would have been rewarded as the Sensex did bounce and made a high of 20498.
After all is said and done, it is best to pay attention to swing highs and swing lows first and foremost. After that, you can attempt to determine the pace of the market.
Danish Kapur (www.danishkapur.com) is a trader and follows both Indian and US markets. He is studying for his master's in business administration at Baruch College, New York and holds a bachelor's degree in technology in electronics and communication engineering from PTU, India.
Originally published in the September 2008 issue of Technical Analysis
of STOCKS & COMMODITIES magazine. All rights reserved. © Copyright
2008, Technical Analysis, Inc.
Return to September 2008 Contents