October 2008
TRADERS' TIPS
You can copy these formulas and programs for easy use in your spreadsheet or analysis software. Simply "select" the desired text by highlighting as you would in any word processing program, then use your standard key command for copy or choose "copy" from the browser menu. The copied text can then be "pasted" into any open spreadsheet or other software by selecting an insertion point and executing a paste command. By toggling back and forth between an application window and the open Web page, data can be transferred with ease.
This month's tips include formulas and programs for:
![]() METASTOCK:
ASYMMETRICAL RSI (ARSI)
METASTOCK:
ASYMMETRICAL RSI (ARSI)
![]() TRADESTATION:
ASYMMETRICAL RSI (ARSI)
TRADESTATION:
ASYMMETRICAL RSI (ARSI)
![]() ESIGNAL:
ASYMMETRICAL RSI (ARSI)
ESIGNAL:
ASYMMETRICAL RSI (ARSI)
![]() WEALTH-LAB:
ASYMMETRICAL RSI (ARSI)
WEALTH-LAB:
ASYMMETRICAL RSI (ARSI)
![]() AMIBROKER:
ASYMMETRICAL RSI (ARSI)
AMIBROKER:
ASYMMETRICAL RSI (ARSI)
![]() NEUROSHELL
TRADER: ASYMMETRICAL RSI (ARSI)
NEUROSHELL
TRADER: ASYMMETRICAL RSI (ARSI)
![]() TD
AMERITRADE'S STRATEGYDESK: ASYMMETRICAL RSI (ARSI)
TD
AMERITRADE'S STRATEGYDESK: ASYMMETRICAL RSI (ARSI)
![]() WORDEN
BROTHERS BLOCKS: ASYMMETRICAL RSI (ARSI)
WORDEN
BROTHERS BLOCKS: ASYMMETRICAL RSI (ARSI)
![]() AIQ:
ASYMMETRICAL RSI (ARSI)
AIQ:
ASYMMETRICAL RSI (ARSI)
![]() TRADERSSTUDIO:
ASYMMETRICAL RSI (ARSI)
TRADERSSTUDIO:
ASYMMETRICAL RSI (ARSI)
![]() NEOTICKER:
ASYMMETRICAL RSI (ARSI)
NEOTICKER:
ASYMMETRICAL RSI (ARSI)
![]() STRATASEARCH:
ASYMMETRICAL RSI (ARSI)
STRATASEARCH:
ASYMMETRICAL RSI (ARSI)
![]() ASPEN
GRAPHICS: ASYMMETRICAL RSI (ARSI)
ASPEN
GRAPHICS: ASYMMETRICAL RSI (ARSI)
![]() OMNITRADER:
ASYMMETRICAL RSI (ARSI)
OMNITRADER:
ASYMMETRICAL RSI (ARSI)
![]() NINJATRADER:
ASYMMETRICAL RSI (ARSI)
NINJATRADER:
ASYMMETRICAL RSI (ARSI)
![]() METATRADER
4: ASYMMETRICAL RSI (ARSI)
METATRADER
4: ASYMMETRICAL RSI (ARSI)
![]() VT
TRADER: ASYMMETRICAL RSI (ARSI)
VT
TRADER: ASYMMETRICAL RSI (ARSI)
or return to October 2008 Contents
METASTOCK: ASYMMETRICAL RSI (ARSI)
Code for the ARSI indicator in MetaStock is already provided in Sylvain
Vervoort's article in this issue, "ARSI, The Asymmetrical RSI."
Subscribers may view the code by logging in to the Subscribers' Area.
Please clicking here
to log in.
TRADESTATION: ASYMMETRICAL RSI (ARSI)
Sylvain Vervoort's article in this issue, "ARSI, The Asymmetrical RSI," describes a modification of J. Welles Wilder's RSI. Unlike the original RSI, which uses a fixed smoothing factor, Vervoort uses asymmetrical averaging periods to smooth the "up closing" and "down closing" price differentials. The following indicator code reproduces these ARSI calculations.
To accommodate the asymmetrical averaging, the code dynamically changes the smoothing lengths of the exponential averages involved. The original EasyLanguage XAverage function requires a fixed smoothing length, so exponential average calculations with dynamic smoothing lengths were added to the code. See Figure 1 for an example.

FIGURE 1: TRADESTATION, ARSI. In this sample TradeStation chart, the ARSI (red line) is compared to the RSI (gray line) on a daily chart of Hewlett-Packard stock (HPQ).The article describes ways to identify divergences with the ARSI. For EasyLanguage code to test the ARSI as a divergence indicator, see our February 2008 Traders' Tip.
To download the EasyLanguage code for this study, go to the TradeStation
and EasyLanguage Support Forum (https://www.tradestation.com/Discussions/forum.aspx?Forum_ID
=213). Search for the file "Arsi.Eld."
Indicator:  ARSI Indicator
inputs:  Price( Close ), Length( 14 ) ;
variables:  ARSIValue( 0 ) ;
ARSIValue = ARSI( Price, Length ) ;
Plot1( ARSIValue, "ARSI" ) ;
Function:  ARSI
inputs:
    Price( numericseries ),
    Length( numericsimple ) ; { this input presumed to
     be a constant and >= 1 }
variables:
    ROCValue( 0 ),
     UpBarMove( 0 ),
    DnBarMove( 0 ),
    UpCount( 0 ),
    DnCount( 0 ),
    UpMove( 0 ),
    DnMove( 0 ),
    RS( 0 ),
    UpExpAverage( 0 ),
    DnExpAverage( 0 ) ;
if Price >= Price[1] then
    begin
    ROCValue = 1 ;
    UpBarMove = Price - Price[1] ;
    DnBarMove = 0 ;
    end
else
    begin
    UpBarMove = 0 ;
    DnBarMove = Price[1] - Price ;
    ROCValue = 0 ;
    end ;
UpCount = Summation( ROCValue, Length ) ;
DnCount = Length - UpCount ;
if CurrentBar = 1 then
    UpMove = UpBarMove
else if UpCount > 0 then
    UpMove = UpMove[1] + 2 / ( ( 2 * UpCount - 1 ) + 1 )
     * ( UpBarMove - UpMove[1] ) ;
if CurrentBar = 1  then
    DnMove = DnBarMove
else if DnCount > 0 then
    DnMove = DnMove[1] + 2 / ( ( 2 * DnCount - 1 ) + 1 )
     * ( DnBarMove - DnMove[1] ) ;
if DnMove = 0 then
    ARSI = -1
else
    ARSI = 100 - ( 100 / ( 1 + ( UpMove / DnMove ) ) ) ;
This article is for informational purposes. No type of trading or
investment recommendation, advice, or strategy is being made, given, or
in any manner provided by TradeStation Securities or its affiliates.
--Mark MillsGO BACK
TradeStation Securities, Inc.
A subsidiary of TradeStation Group, Inc.
www.TradeStation.com
ESIGNAL: ASYMMETRICAL RSI (ARSI)
For this month's Traders' Tip, we've provided the eSignal formula, Arsi.efs, based on the code from Sylvain Vervoort's article in this issue, "ARSI, The Asymmetrical RSI."
The study contains formula parameters that may be configured through the Edit Studies option to set the period length, upper band, lower band, and colors of both the RSI and ARSI.
A sample chart is shown in Figure 2.

FIGURE 2: eSIGNAL, ARSI. This sample eSignal chart shows the ARSI indicator on a daily chart of GM.To discuss this study or download a complete copy of the formula code, please visit the EFS Library Discussion Board forum under the Forums link at www.esignalcentral.com or visit our EFS KnowledgeBase at www.esignalcentral.com/support/kb/efs/. The eSignal formula scripts (EFS) are also available for copying and pasting from the STOCKS & COMMODITIES website at Traders.com.
/*********************************
Provided By:
eSignal (Copyright c eSignal), a division of Interactive Data Corporation. 2008. All rights reserved.
This sample eSignal Formula Script (EFS) is for educational purposes only and may be modified and saved
under a new file name. eSignal is not responsible for the functionality once modified. eSignal reserves
the right to modify and overwrite this EFS file with each new release.

Description:
    ARSI, The Asymmetrical RSI by Sylvain Vervoort
Version:            1.0  08/07/2008
Notes:
    October 2008 issue of Stocks & Commodities Magazine
Formula Parameters:                  Default:
    Period                                     14
    Upper Band                             70
    Lower Band                               30
    ARSI Color                                Blue
    RSI Color                                   Red
    Show Parameters                      False
**********************************/
var fpArray = new Array();
function preMain() {
    setPriceStudy(false);
    setStudyTitle("ARSI ");
    setCursorLabelName("ARSI", 0);
    setCursorLabelName("RSI", 1);
    setDefaultBarFgColor(Color.blue, 0);
    setDefaultBarFgColor(Color.red, 1);
    setPlotType(PLOTTYPE_LINE, 0);
    setPlotType(PLOTTYPE_LINE, 1);
    setDefaultBarThickness(1, 0);
    setDefaultBarThickness(1, 1);
    askForInput();
    var x=0;
    fpArray[x] = new FunctionParameter("Period", FunctionParameter.NUMBER);
    with(fpArray[x++]){
        setName("Period");
        setLowerLimit(1);
        setUpperLimit(100);
        setDefault(14);
    }
    fpArray[x] = new FunctionParameter("Color1", FunctionParameter.COLOR);
    with(fpArray[x++]){
        setName("ARSI Color");
        setDefault(Color.blue);
    }
    fpArray[x] = new FunctionParameter("Color2", FunctionParameter.COLOR);
    with(fpArray[x++]){
        setName("RSI Color");
        setDefault(Color.red);
    }
    fpArray[x] = new FunctionParameter("Upper", FunctionParameter.NUMBER);
    with(fpArray[x++]){
        setName("Upper Band");
        setLowerLimit(0);
        setDefault(70);
    }
    fpArray[x] = new FunctionParameter("Lower", FunctionParameter.NUMBER);
    with(fpArray[x++]){
        setName("Lower Band");
        setLowerLimit(0);
        setDefault(30);
    }
    fpArray[x] = new FunctionParameter("ShowParam", FunctionParameter.BOOLEAN);
    with(fpArray[x++]){
       setName("Show Parameters");
       setDefault(false);
    }
}
var xSum1 = null
var xSum2 = null;
var xSum3 = null;
var xSum4 = null;
var xRSI  = null;
var bInit = false;
var bVersion = null;
function main(Period, Upper, Lower, Color1, Color2, ShowParam){
    if (bVersion == null) bVersion = verify();
    if (bVersion == false) return;
    if(getCurrentBarCount()<Period) return;
    if(bInit==false){
        xSum1 = efsInternal("Sum",Period);
        xSum2 = getSeries(xSum1,1);
        xSum3 = getSeries(xSum1,2);
        xSum4 = getSeries(xSum1,3);
        xRSI = rsi(Period);
        addBand(Upper,PS_SOLID,1,Color.grey,"UpperBand");
        addBand(Lower,PS_SOLID,1,Color.grey,"LowerBand");
        setShowTitleParameters( ShowParam );
        bInit=true;
    }
    var xUpMoveAvg = ema((xSum1.getValue(0)*2)-1,xSum3);
    var xDnMoveAvg = ema((xSum2.getValue(0)*2)-1,xSum4);

    if(xUpMoveAvg==null||xDnMoveAvg==null) return;
    var RS = xUpMoveAvg.getValue(0)/xDnMoveAvg.getValue(0);
    var nRSI = xRSI.getValue(0);
    if(nRSI==null) return;
    return new Array (100-(100/(1+RS)),nRSI)
}
var xMom = null;
var xInit = false;
function Sum(Period){
    if(xInit==false){
        xMom = mom(1);
        xInit = true;
    }
    var nSum = 0;
    for(var i = 0; i < Period; i++){
        if(xMom.getValue(-i) >= 0) {
            nSum += 1;
        }
    }

    var UpCount = nSum;
    var DnCount = Period-UpCount;
    var UpMove = xMom.getValue(0)>=0?xMom.getValue(0):0;
    var DnMove = xMom.getValue(0)<0?Math.abs(xMom.getValue(0)):0;
    return new Array(UpCount,DnCount,UpMove,DnMove);
}
function verify() {
    var b = false;
    if (getBuildNumber() < 779) {
        drawTextAbsolute(5, 35, "This study requires version 8.0 or later.",
            Color.white, Color.blue, Text.RELATIVETOBOTTOM|Text.RELATIVETOLEFT|Text.BOLD|Text.LEFT,
            null, 13, "error");
        drawTextAbsolute(5, 20, "Click HERE to upgrade.@URL=https://www.esignal.com/download/default.asp",
            Color.white, Color.blue, Text.RELATIVETOBOTTOM|Text.RELATIVETOLEFT|Text.BOLD|Text.LEFT,
            null, 13, "upgrade");
        return b;
    } else {
        b = true;
    }
    return b;
}
--Jason KeckGO BACK
eSignal, a division of Interactive Data Corp.
800 815-8256, www.esignalcentral.com
WEALTH-LAB: ASYMMETRICAL RSI (ARSI)
Out of possible ways of detecting divergences, in some of our past Traders' Tips contributions we have already presented two. One sophisticated technique that we presented in our February 2008 tip based on Sylvain Vervoort's February 2008 STOCKS & COMMODITIES article, "Trading Medium-Term Divergences," detects and highlights divergences by any indicator. Since it relies on finding peaks and troughs, price must retrace by some amount before a peak/trough occurs. Another approach, which we presented in our July 2008 tip based on "Leader Of The MACD" by Giorgos Siligardos, is simplistic, identifying a divergence between price and indicator when it fails to confirm a price extreme (for example, the highest high). Relying on price action makes it act a tad quicker.
The system we're presenting here based on Sylvain Vervoort's article in this issue, "ARSI, The Asymmetrical RSI," catches bullish divergences of the asymmetrical RSI (ARSI), with price based on the second approach. As seen in Figure 3, two potentially profitable opportunities could be taken as a result of timely signaling from the 14-period ARSI, which in its turn seems to be very responsive -- as responsive as the half-period RSI.

FIGURE 3: WEALTH-LAB, ARSI. As an illustration of the ARSI technique on a long trade in the OIH ETF, the ARSI turns out to signal two timely bullish divergence trades.Readers might like to explore the ARSI crossovers and crossunders, because the threshold levels are reached more timely than with the classic RSI. The strategy exits after 20 bars neutrally. It offers room for improvement; however, a quick test over 1,000 bars of daily data on a diversified portfolio containing 16 most liquid ETFs turned out profitable.
You will find ARSI in your Wealth-Lab installation, organized under
the "Tasc Magazine Indicators" group. This allows you to quickly use it
in rule-based strategies as an entry or exit condition without having to
program any code (Figure 4).

FIGURE 4: WEALTH-LAB, PROFITABILITY. A chart that combines the portfolio equity curve with the drawdown chart indicates overall profitability of the approach.
WealthScript strategy code:
using System;
using System.Collections.Generic;
using System.Text;
using System.Drawing;
using WealthLab;
using WealthLab.Indicators;
using TASCIndicators;
namespace WealthLab.Strategies
{
    /*
        ARSI divergence:
        Price sets a lowest low but the indicator fails to confirm the new low and turns up
    */
    public class ARSI_Divergence : WealthScript
    {
        private StrategyParameter paramHighest;
        private StrategyParameter paramPeriod;
        private StrategyParameter paramExitDays;
        public ARSI_Divergence()
        {
            paramPeriod = CreateParameter("ARSI period", 14, 1, 100, 1);
            paramHighest = CreateParameter("Highest high of", 20, 5, 50, 1);
            paramExitDays = CreateParameter("Exit after", 20, 1, 50, 1);
        }
        protected override void Execute()
        {
            bool trough = false; int troughBar = -1;
            int low = paramHighest.ValueInt;
            int period = paramPeriod.ValueInt;
            int days = paramExitDays.ValueInt;
            ARSI arsi = ARSI.Series( Close, period );
            Lowest indicatorLowest = Lowest.Series( arsi, low );
            Lowest hLow = Lowest.Series( Low, low );
            HideVolume(); LineStyle solid = LineStyle.Solid;
            ChartPane arsiPane = CreatePane( 50, false, true );
            PlotSeries( arsiPane, arsi, Color.Green, solid, 2 );
            PlotSeries( arsiPane, RSI.Series( Close, period ), Color.Red, solid, 1 );
            for(int bar = 80; bar < Bars.Count; bar++)
            {
                if (!IsLastPositionActive)
                {
                    /* 1st trough: both price and indicator */
                    if( trough == false )
                    {
                        if( ( Low[bar-1] == Lowest.Series( Low, low )[bar-1] )
                        & ( arsi[bar-1] == Lowest.Series( arsi, low )[bar-1] )
                            & TurnUp( bar, Low ) & TurnUp( bar, arsi ) )
                        {
                            trough = true; troughBar = bar-1;
                        }
                    }
                    if( trough == true )
                    {
                        if( ( Low[bar] != Lowest.Series( Low, low )[bar] )
                        & ( arsi[bar] == Lowest.Series( arsi, low )[bar] ) )
                            trough = false;
                    }
                    /* 2nd trough: price low not confirmed by the indicator */
                    if( trough == true )
                    {
                        if( ( Low[bar-1] == Lowest.Series( Low, low )[bar-1] )
                        & ( Low[bar-1] <= Low[troughBar] )
                        & ( arsi[bar-1] != Lowest.Series( arsi, low )[bar-1] )
                            & ( arsi[bar-1] > arsi[troughBar] ) &
                            TurnUp( bar, Low ) & TurnUp( bar, arsi ) )
                        {
                            trough = false;
                            BuyAtMarket( bar+1 );
                            /* Highlight divergence */
                            for (int b = troughBar; b <= bar; b++)
                                SetPaneBackgroundColor( arsiPane, b,
                                Color.FromArgb( 30, Color.LightGreen ) );
                            DrawLine( PricePane, troughBar, Low[troughBar],
                            bar-1, Low[bar-1], Color.Blue, solid, 2 );
                            DrawLine( arsiPane, troughBar, arsi[troughBar],
                            bar-1, arsi[bar-1], Color.Red, solid, 2 );
                        }
                    }
                } else
                {
                    /* Exit after N days */
                    Position p = LastPosition;
                    if ( bar+1 - p.EntryBar >= days )
                        SellAtMarket( bar+1, p, "Timed" );
                }
            }
        }
    }
}
-- Robert Sucher and Eugene
www.wealth-lab.com
AMIBROKER: ASYMMETRICAL RSI (ARSI)
In "ARSI, The Asymmetrical RSI" in this issue, Sylvain Vervoort presents a modification of the classic RSI formula.
The MetaStock formula given in the article uses the LastValue() function that looks into the future. Thus, in our coding, we decided to present two versions of the ARSI: one that mimics the original version in the article, which uses a constant period and SelectedValue() that may look into the future; and another version that uses variable periods (evaluated on a bar-by-bar basis) that does not look into the future, making it backtest-safe. Both versions are included in Listing 1.
In addition, a standard RSI is also plotted with the formula. To use
it, simply enter the code into the Formula Editor, then choose Tools->Apply
Indicator menu from the editor. You can use the parameters window (available
from the right-click menu) to set the period for ARSI.
AmiBroker LISTING 1
// Version 1.
// ARSI formula
// constant period version (looks into the future)
Period = Param("ARSI Period", 14, 1, 100 );
Chg = C - Ref( C, -1 );
UpCount = Sum( Chg >= 0, Period );
DnCount = Period - UpCount;
UpMove = EMA( Max( Chg, 0 ), SelectedValue( UpCount) * 2 - 1 );
DnMove = EMA( Max( -Chg, 0 ), SelectedValue( DnCount ) * 2 - 1 );
RS = UpMove/DnMove;
ARSI = 100-(100/(1+RS));
Plot( ARSI, "ARSI("+Period+")", colorBlue );
// Version 2.
// ARSI formula
// variable  period version (backtest-safe)
Period = Param("ARSI Period", 14, 1, 100 );
Chg = C - Ref( C, -1 );
UpCount = Sum( Chg >= 0, Period );
DnCount = Period - UpCount;
UpMove = AMA( Max( Chg, 0 ), 1/UpCount );
DnMove = AMA( Max( -Chg, 0 ), 1/DnCount );
RS = UpMove/DnMove;
ARSI = 100-(100/(1+RS));
Plot( ARSI, "ARSI_V("+Period+")", colorGreen );
Plot( RSI( Period ), "RSI", colorRed );
A sample chart is shown in Figure 5.
--Tomasz Janeczko, AmiBroker.comFIGURE 5: AMIBROKER, ARSI. Here is a daily chart of HPQ showing the constant-period ARSI (blue); the variable-period backtest-safe ARSI (green); and the classic RSI (red).
www.amibroker.com
NEUROSHELL TRADER: ASYMMETRICAL RSI (ARSI)
The asymmetrical RSI indicator as described by Sylvain Vervoort in his article in this issue, "ARSI, The Asymmetrical RSI," can be easily implemented in NeuroShell Trader using NeuroShell Trader's ability to program functions in standard languages such as C, C++, Power Basic, or Delphi. You can recreate the asymmetrical RSI indicator (Figure 6) by moving the code given in the article to your preferred compiler and creating the corresponding function. You can insert the resulting indicator as follows:
Users of NeuroShell Trader can go to the STOCKS & COMMODITIES section of the NeuroShell Trader free technical support website to download a copy of this or any previous Traders' Tips.1. Select "New Indicator ..." from the Insert menu. 2. Choose the Custom Indicator category. 3. Select the Arsi indicator. 4. Select the Finished button.
FIGURE 6: NEUROSHELL, ARSI. Here is a sample NeuroShell chart demonstrating the asymmetrical RSI against the traditional RSI.
--Marge Sherald, Ward Systems Group, Inc.
301 662-7950, sales@wardsystems.com
www.neuroshell.com
TD AMERITRADE'S STRATEGYDESK: ASYMMETRICAL RSI (ARSI)
In this issue, Sylvain Vervoort discusses a variation of the RSI in his article, "ARSI, The Asymmetrical RSI." Here is an interpretation of the ARSI using TD Ameritrade's StrategyDesk.
In the article, Vervoort modifies J. Welles Wilder's classic RSI to identify more reliable divergences than those found using the original RSI. The original RSI looks at momentum to measure the speed at which a security is changing. The original RSI formula is as follows:
The RS portion of the equation is calculated by taking the average gain and dividing it by the average loss based on the RSI period, irrespective of the number of up or down bars in the period. The author suggests that it is more logical to use the number of up bars for averaging the up closing and the number of down bars for averaging the down closing for the chosen RSI period, thus giving you the ARSI, or asymmetrical RSI. ARSI incorporates Wilder's smoothing method of two times the up/down price counter minus 1. The advantage of ARSI is that it can identify entry and exit points quicker than RSI. The disadvantage is that it has a higher probability of giving false entry and exit points.Rsi = 100 - 100/(1+RS)
To recreate this as a custom chart indicator in StrategyDesk, assuming
an ARSI period of 14, use the following formula:
ARSI:
100 - (100 / (1 +
(((MomentumROC[Momentum,Close,1,0,D] >= 0) * MomentumROC[Momentum,Close,1,0,D] +
(MomentumROC[Momentum,Close,1,0,D,1] >= 0) * MomentumROC[Momentum,Close,1,0,D,1] +
(MomentumROC[Momentum,Close,1,0,D,2] >= 0) * MomentumROC[Momentum,Close,1,0,D,2] +
(MomentumROC[Momentum,Close,1,0,D,3] >= 0) * MomentumROC[Momentum,Close,1,0,D,3] +
 (MomentumROC[Momentum,Close,1,0,D,4] >= 0) * MomentumROC[Momentum,Close,1,0,D,4] +
(MomentumROC[Momentum,Close,1,0,D,5] >= 0) * MomentumROC[Momentum,Close,1,0,D,5] +
(MomentumROC[Momentum,Close,1,0,D,6] >= 0) * MomentumROC[Momentum,Close,1,0,D,6] +
(MomentumROC[Momentum,Close,1,0,D,7] >= 0) * MomentumROC[Momentum,Close,1,0,D,7] +
(MomentumROC[Momentum,Close,1,0,D,8] >= 0) * MomentumROC[Momentum,Close,1,0,D,8] +
(MomentumROC[Momentum,Close,1,0,D,9] >= 0) * MomentumROC[Momentum,Close,1,0,D,9] +
(MomentumROC[Momentum,Close,1,0,D,10] >= 0) * MomentumROC[Momentum,Close,1,0,D,10] +
(MomentumROC[Momentum,Close,1,0,D,11] >= 0) * MomentumROC[Momentum,Close,1,0,D,11] +
(MomentumROC[Momentum,Close,1,0,D,12] >= 0) * MomentumROC[Momentum,Close,1,0,D,12] +
(MomentumROC[Momentum,Close,1,0,D,13] >= 0) * MomentumROC[Momentum,Close,1,0,D,13]) /
(2 * ((MomentumROC[Momentum,Close,1,0,D] >= 0) + (MomentumROC[Momentum,Close,1,0,D,1] >= 0) +
(MomentumROC[Momentum,Close,1,0,D,2] >= 0) + (MomentumROC[Momentum,Close,1,0,D,3] >= 0) +
(MomentumROC[Momentum,Close,1,0,D,4] >= 0) + (MomentumROC[Momentum,Close,1,0,D,5] >= 0) +
(MomentumROC[Momentum,Close,1,0,D,6] >= 0) + (MomentumROC[Momentum,Close,1,0,D,7] >= 0) +
(MomentumROC[Momentum,Close,1,0,D,8] >= 0) + (MomentumROC[Momentum,Close,1,0,D,9] >= 0) +
(MomentumROC[Momentum,Close,1,0,D,10] >= 0) + (MomentumROC[Momentum,Close,1,0,D,11] >= 0) +
(MomentumROC[Momentum,Close,1,0,D,12] >= 0) + (MomentumROC[Momentum,Close,1,0,D,13] >= 0)) - 1)) /
(-1 * ((MomentumROC[Momentum,Close,1,0,D] < 0) * MomentumROC[Momentum,Close,1,0,D] +
(MomentumROC[Momentum,Close,1,0,D,1] < 0) * MomentumROC[Momentum,Close,1,0,D,1] +
(MomentumROC[Momentum,Close,1,0,D,2] < 0) * MomentumROC[Momentum,Close,1,0,D,2] +
(MomentumROC[Momentum,Close,1,0,D,3] < 0) * MomentumROC[Momentum,Close,1,0,D,3] +
(MomentumROC[Momentum,Close,1,0,D,4] < 0) * MomentumROC[Momentum,Close,1,0,D,4] +
(MomentumROC[Momentum,Close,1,0,D,5] < 0) * MomentumROC[Momentum,Close,1,0,D,5] +
(MomentumROC[Momentum,Close,1,0,D,6] < 0) * MomentumROC[Momentum,Close,1,0,D,6] +
(MomentumROC[Momentum,Close,1,0,D,7] < 0) * MomentumROC[Momentum,Close,1,0,D,7] +
(MomentumROC[Momentum,Close,1,0,D,8] < 0) * MomentumROC[Momentum,Close,1,0,D,8] +
(MomentumROC[Momentum,Close,1,0,D,9] < 0) * MomentumROC[Momentum,Close,1,0,D,9] +
(MomentumROC[Momentum,Close,1,0,D,10] < 0) * MomentumROC[Momentum,Close,1,0,D,10] +
(MomentumROC[Momentum,Close,1,0,D,11] < 0) * MomentumROC[Momentum,Close,1,0,D,11] +
(MomentumROC[Momentum,Close,1,0,D,12] < 0) * MomentumROC[Momentum,Close,1,0,D,12] +
(MomentumROC[Momentum,Close,1,0,D,13] < 0) * MomentumROC[Momentum,Close,1,0,D,13]) /
(2 * ((MomentumROC[Momentum,Close,1,0,D] < 0) + (MomentumROC[Momentum,Close,1,0,D,1] < 0) +
(MomentumROC[Momentum,Close,1,0,D,2] < 0) + (MomentumROC[Momentum,Close,1,0,D,3] < 0) +
(MomentumROC[Momentum,Close,1,0,D,4] < 0) + (MomentumROC[Momentum,Close,1,0,D,5] < 0) +
(MomentumROC[Momentum,Close,1,0,D,6] < 0) + (MomentumROC[Momentum,Close,1,0,D,7] < 0) +
(MomentumROC[Momentum,Close,1,0,D,8] < 0) + (MomentumROC[Momentum,Close,1,0,D,9] < 0) +
(MomentumROC[Momentum,Close,1,0,D,10] < 0) +  (MomentumROC[Momentum,Close,1,0,D,11] < 0) +
(MomentumROC[Momentum,Close,1,0,D,12] < 0) + (MomentumROC[Momentum,Close,1,0,D,13] < 0)) - 1))
))
Sylvain Vervoort's formula incorporates an exponential moving average
into the ARSI indicator. However, this indicator is replicated in StrategyDesk
using simple moving averages for the up and down price data.
The overbought and oversold levels from the original RSI indicator can be used for ARSI. When ARSI crosses 30 in an upward direction, this indicates a buy signal. When ARSI crosses 70 in a downward direction, this indicates a sell signal. (See Figure 7.)

FIGURE 7: TD AMERITRADE STRATEGYDESK, ARSI. The price chart shows the 14-day ARSI indicator (red) and a backtest for ARSI crossing 30 or 70 for WMT since February 2008. In the backtest, ARSI generated a buy signal on 3/4/08 at a price of $49.87 and a sell signal on 4/9/08 at a price of $54.14. These buy and sell signals are identified with arrows on the price chart.If you have questions about this formula or functionality, please call TD Ameritrade's StrategyDesk help line at 800 228-8056, free of charge, or access the Help Center via the StrategyDesk application. StrategyDesk is a downloadable application free for all TD Ameritrade clients. Regular commission rates apply.
TD Ameritrade and StrategyDesk do not endorse or recommend any particular trading strategy.
--Jeff Anderson
TD AMERITRADE Holding Corp.
www.tdameritrade.com
WORDEN BROTHERS BLOCKS: ASYMMETRICAL RSI (ARSI)
Note: To use the indicators and charts in this Traders' Tip, you will need the free Blocks software. Go to www.Blocks.com to download the software and get free US stock charts and scans.
The indicator discussed by Sylvain Vervoort in his article in this issue, "ARSI, The Asymmetrical RSI," is available in the Blocks indicator library. To load the indicator, click the Indicators button, click on the "SC Traders Tips" folder, then click on "ARSI - The Asymmetrical RSI" and drag it onto the chart.
In Figure 8, ARSI makes a clear break below the 30 level (C), which creates a negative divergence with price (A). Wilder's RSI (B) remains relatively flat throughout the same period.

FIGURE 8: BLOCKS, ARSI. This sample chart from Worden Brothers shows the asymmetrical RSI (cyan) versus the classic RSI (red).To download the Blocks software and get free US stock charts and scans, go to www.Blocks.com.
--Patrick Argo and Jake Karlsmark
Worden Brothers, Inc.
AIQ: ASYMMETRICAL RSI (ARSI)
The AIQ code for Sylvain Vervoort's article, "ARSI, The Asymmetrical RSI," is shown here. Vervoort's version of the indicator, which is a variation of J. Welles Wilder's relative strength index or RSI, is illustrated using divergence of price with the ARSI indicator. A system to test the indicator was suggested but not specifically described by the author. To test the indicator, I devised a simple trading system based on the author's suggested divergence. The rules of the system are as follows.
Enter a long position when:
1) Today's low is less than the last pivot low of
10 bar strength, and
2) Today's ARSI value is greater than its value on
the date of the price pivot low of 10 bar strength, and
3) The ARSI has been less than 30 in the last two
bars, and
4) This is the first such signal in the last two
bars.
I ran an EDS test, which shows all signals, using the NASDAQ 100 list of stocks.
The exit rules for long positions are:
1) If the ARSI is greater than 70, or
2) If the bars in the position are greater than or equal to 3 and the
ARSI is less than 50, or
3) If the bars in the position are greater than or equal to 10.
The short sale rules are the inverse of the long rules and my testing was symmetrical.
I was curious as to whether the new indicator would outperform the original Wilder RSI. Vervoort indicates there should be more signals using the ARSI than from the RSI due to the modified indicator's higher volatility. I used the same system and parameters as outlined above but substituted the RSI where the ARSI indicator was used. I ran comparative tests over the period 10/15/2002 to 7/1/2008, which was a mostly bullish period.
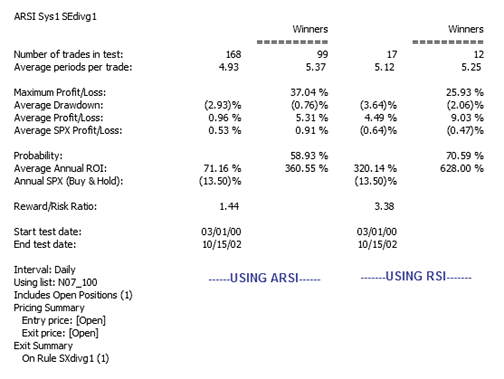
On the long-only test comparison, shown in Figure 9, the ARSI system is shown in the left two columns compared with the RSI system in the right two columns. There are almost six times more signals in the ARSI system, confirming the author's view of the modified indicator. In addition, the performance of the modified indicator is better than the original RSI version, with the average profit per trade improving by 2.5 times and the reward-to-risk ratio improving by 1.2 times. The short-side-only test comparison was run over a mostly bearish period of 3/1/2000 to 10/15/2002, shown in Figure 10. The other metrics for the ARSI on the short side test are worse than for the RSI, but the RSI had only 17 trades in the test and this sample is not large enough to be reliable. A trading system could more easily be built around the ARSI indicator with divergences than around the RSI.

FIGURE 9: AIQ, LONG SIDE SYSTEM TEST FOR ARSI. Here is a comparison of the ARSI indicator trading the NASDAQ 100 stocks (long side only) versus the same system with the RSI replacing the ARSI during a generally bullish period from 10/15/2002 to 7/1/2008. On most metrics, the ARSI is superior to the RSI system for the long side.The code can be downloaded from the AIQ website at www.aiqsystems.com or from www.tradersedgesystems.com/traderstips.htm. It also can be copied and pasted from the STOCKS & COMMODITIES website at Traders.com.
FIGURE 10: AIQ, SHORT SIDE SYSTEM TEST FOR ARSI. Here is a comparison of the ARSI indicator trading the NASDAQ 100 stocks (short side only) versus the same system with the RSI replacing the ARSI during a generally bearish period from 3/1/2000 to 10/15/2002. Although the metrics appear worse for the ARSI system on the short side, there are not enough trades for the RSI system to draw any valid conclusions.
!! ASYMMETRICAL RSI
! Author: Sylvain Vervoort, TASC October 2008
! Coded by: Richard Denning 08/08/08
! ABBREVIATIONS:
C     is [close].
C1     is valresult(C,1).
H     is [high].
H1    is valresult(H,1).
L     is [low].
L1     is valresult(L,1).
O     is [open].
PEP     is {position entry price}.
PD     is {position days}.
!! RSI WILDER
! To convert Wilder Averaging to Exponential Averaging:
! ExponentialPeriods = 2 * WilderPeriod - 1.
U     is C - valresult(C,1).
D     is valresult(C,1) - C.
WilderLen is 14.
rsiLen    is 2 * WilderLen - 1.
AvgU    is ExpAvg(iff(U>0,U,0),rsiLen).
AvgD     is ExpAvg(iff(D>=0,D,0),rsiLen).
RSI     is 100-(100/(1+(AvgU/AvgD))).
!! ASYMETRICAL RSI
Ucount     is countof(U>0,WilderLen).
Dcount    is WilderLen - Ucount.
AvgUasym is expavg(iff(U>0,U,0),Ucount*2-1).
AvgDasym is expavg(iff(D>=0,D,0),Dcount*2-1).
ARSI  is 100-(100/(1+(AvgUasym/AvgDasym))). ! ARSI
! PIVOT FINDER SETUP INFORMATION:
Define periods 252. !Total look back period
strength is 10.     !Number of bars on each side of pivot
OTD     is Offsettodate(Month(),Day(),Year()).
LowR     is Lowresult(L,(2*strength)+1).
LowM    is valresult(L,strength).
LS     if  LowR = LowM.
HighR    is highresult(H,(2*strength)+1).
HighM     is valresult(H,strength).
HS     if  HighR = HighM.
! FIND FIRST PIVOT LOW
LT1     is scanany(LS,periods) then OTD .
LO1     is ^LT1 + Strength.
LO1dte     is SetDate(LO1).
LowLO1     is valresult(L,^LO1).
! FIND FIRST PIVOT HIGH
HT1    is scanany(HS,periods,0) then OTD .
HO1    is ^HT1 + Strength.
HO1dte    is SetDate(HO1).
HighHO1     is valresult(H,HO1).
LO1spx    Is TickerUDF("SPX",LO1).
LO1dteSPX is TickerUDF("SPX",LO1dte).
HO1spx    is TickerUDF("SPX",HO1).
HO1dteSPX is TickerUDF("SPX",HO1dte).
LLstr1    is lowresult(L,strength,1).
HHstr1    is highresult(H,strength,1).
! LONG SIDE DIVERGENCE STRATEGY USING ARSI:
! BUY  when today's low is lower than the last low pivot of
!    X bar strength and the ARSI shows a higher low
!    yesterday compared to its value on the low price
!    pivot date and ARSI is oversold:
LEdivg     if  L <= LowLO1
    and ARSI > valresult(ARSI,^LO1)
    and countof(ARSI < 30,2)>=1.
LEdivg1    if LEdivg and countof(LEdivg,15,1)=1.
LXdivg1 if ARSI > 70 or (PD >=3 and ARSI < 50) or PD >= 10.
! CODE FOR LONG SIDE COMPARATIVE TEST USING RSI:
LEdivgR     if  L <= LowLO1
    and RSI > valresult(RSI,^LO1)
    and countof(RSI < 30,2)>=1.
LEdivgR1 if LEdivgR and countof(LEdivgR,15,1)=1.
LXdivgR1 if RSI > 70 or (PD >=3 and RSI < 50) or PD >= 10.
! SHORT SIDE DIVERGENCE STRATEGY USING ARSI:
! SELL SHORT  when today's high is higher than the last high
!    pivot of X bar strength and the ARSI shows a lower
!    high today compared to its value on the high price
!     pivot date and ARSI is overbought:
SEdivg     if  H >= HighHO1
    and valresult(ARSI,^HO1) > ARSI
    and ARSI > 70.
SEdivg1 if SEdivg and countof(SEdivg,15,1)=1.
SXdivg1 if ARSI < 30 or (PD >=3 and ARSI > 50) or PD >= 10.
SEdivgR if  H >= HighHO1
    and valresult(RSI,^HO1) > RSI
    and RSI > 70.
SEdivgR1 if SEdivgR and countof(SEdivgR,15,1)=1.
SXdivgR1 if RSI < 30 or (PD >=3 and RSI > 50) or PD >= 10.
--Richard Denning
richard.denning@earthlink.net
TRADERSSTUDIO: ASYMMETRICAL RSI (ARSI)
The TradersStudio code for Sylvain Vervoort's article, "ARSI, The Asymmetrical RSI," is shown here. Vervoort's version of the indicator, which is a variation of J. Welles Wilder's relative strength index or RSI, is shown by Vervoort to be an improvement over the classic ARSI when used to spot divergences. A system using divergence to test the indicator was suggested but not specifically described by the author. To test the indicator, I devised a simple trading system based on Vervoort's suggested divergence. The rules of the system are as follows.
Enter a long position when:
1) Today's low is less than the last pivot low of
20 bar strength, and
2) Today's ARSI value is greater than its value
on the date of the price pivot low of 20 bar strength, and
3) The ARSI has been less than 30 in the last
two bars, and
4) This is the first such signal in the last
two bars,
5) Enter on a stop next bar at high of the
setup bar.
The exit rules for long positions:
1) If the ARSI is greater than 70, or
2) If a closing basis loss of 3 or more average
true ranges (ATRs) occurs
3) Exit at market at next day's opening price.
The short sale rules are the inverse of the long rules except the exit parameter for the short sales on the ARSI and RSI was set to 40 rather than the 30 value that would be used if symmetrical testing had been used.
I ran both session-level tests and trade-plan level tests using three full-size futures contracts on the stock indexes, Russell 2000 (RL), S&P Midcap 400 (MD), and the Nasdaq 100 (ND). The trade plan used was one of the plans that come with the product called "TS_Percentrisk," using 6% of the account balance to risk on each trade with starting capital of $1,000,000. The code for this trade plan is not shown since it comes with the software. The risk was set at three ATRs, the same as the stop-loss level.
In order to determine whether the new indicator would outperform the original Wilder RSI, I used the same system and parameters, portfolio, and trade plan as outlined above but substituted the RSI where the ARSI indicator was used. I ran comparative tests over the period 2/13/1992 to 8/12/2008. A summary of the key metrics that resulted from running the trade-plan-level tests on both systems using the 6% risk per trade is shown in the table in Figure 11. The ARSI system is shown in the left column compared with the RSI system in the right column. Vervoort indicates there should be more signals using the ARSI versus the RSI due to the modified indicator's higher volatility, and this was verified by my tests -- there are almost seven times more signals on the ARSI system. In addition, almost all of the key metrics were significantly better using the ARSI over the RSI. A divergence trading system could more easily be built around the ARSI indicator than around the RSI, as there are more and better signals using the ARSI.
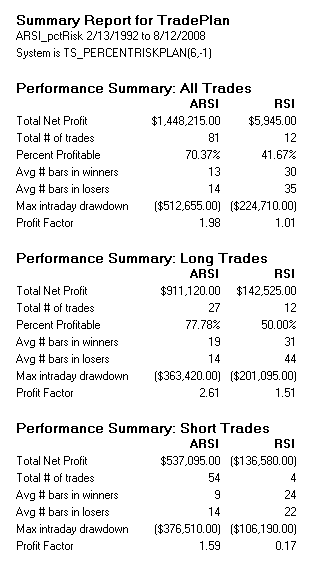
FIGURE 11: TRADERSSTUDIO, COMPARISON TABLE OF ARSI VS. RSI. Here is a comparison of the ARSI indicator trading the three full-size index futures (RL, MD, ND) versus the same system but using the RSI instead of the ARSI over the period from 2/13/1992 to 8/12/2008. On most metrics, the ARSI is superior to the RSI system.The TradersStudio code can be downloaded from the TradersStudio website at www.TradersStudio.com ->Traders Resources->FreeCode and also from www.TradersEdgeSystems.com/traderstips.htm, or can be copied and pasted from the STOCKS & COMMODITIES website at Traders.com.
' ASYMMETRICAL RSI DIVERGENCE SYSTEM FOR TESTING ARSI
' Author: Sylvain Vervoort, TASC October 2008
' Coded by: Richard Denning 08/11/08
Sub ARSItest(aRSILen,pivotStr,longARSIexitLvl, shortARSIexitLvl)
Dim sLowBars, sHighBars, LB  As Integer
Dim sHigh, sLow, myATR As Double
Dim myARSI As BarArray
LB = 150  'set bars back to LB + pivotStr + 1
sLow = swingLow(1,L,pivotStr,LB)
sLowBars = swingLowBar(1,L,pivotStr,LB)
sHigh = swingHigh(1,H,pivotStr,LB)
sHighBars = swingHighBar(1,H,pivotStr,LB)
myARSI = ARSI(C,aRSILen)
myATR = Average(TrueRange, LB)
If sLowBars > 0 Then
    If L <= sLow And myARSI > myARSI[sLowBars] And myARSI < 30 Then
        Buy("LE_divg1",1,H,Stop,Day)
    End If
End If
If sHighBars > 0 Then
    If H >= sHigh And myARSI < myARSI[sHighBars] And myARSI > 70 Then
        Sell("SE_divg1",1,L,Stop,Day)
    End If
End If
If myARSI > longARSIexitLvl Then ExitLong("LX_70","",1,0,Market,Day)
If C < EntryPrice - 3 * myATR Then ExitLong("LX_loss","",1,0,Market,Day)
If myARSI < shortARSIexitLvl Then ExitShort("SX_30","",1,0,Market,Day)
If C > EntryPrice + 3 * myATR Then ExitShort("SX_loss","",1,0,Market,Day)
SetTradeRisk(3 * myATR)
End Sub
'------

' ASYMMETRICAL RSI FUNCTION
' Author: Sylvain Vervoort, TASC October 2008
' Coded by: Richard Denning 08/11/08
Function ARSI(price As BarArray, arsiLen As Integer)
Dim upValue, dnValue, upCount, dnCount, avgUp, avgDn As Double
Dim i As Integer
Dim upVals, dnVals As BarArray
For i = 0 To arsiLen - 1
    If price[i] >= price[i+1] Then
        upCount = upCount + 1
        upVals[i] = price[i] - price[i+1]
        dnVals[i] = 0
    Else
        upVals[i] = 0
        dnVals[i] = price[i+1] - price[i]
    End If
Next
dnCount = arsiLen - upCount
If upCount > 0 Then avgUp = XAverage(upVals,upCount*2-1,0)
if dncount > 0 then avgDn = XAverage(dnVals,dnCount*2-1,0)
If avgDn > 0 Then
    ARSI = 100 - (100 / (1 + (avgUp / avgDn)))
Else
    ARSI = 0
End If
End Function
'------

' ASYMMETRICAL RSI INDICATOR
' Author: Sylvain Vervoort, TASC October 2008
' Coded by: Richard Denning 08/11/08
Sub ARSI_ind(rsiLen)
Dim myRSI, myARSI As BarArray
myRSI = RSI(C, rsiLen, 0)
myARSI = ARSI(C, rsiLen)
plot1(myRSI)
plot2(myARSI)
plot3(70)
plot4(30)
End Sub
--Richard Denning
richard.denning@earthlink.net
NEOTICKER: ASYMMETRICAL RSI (ARSI)
We can use formula language in NeoTicker to implement the asymmetrical RSI as presented in Sylvain Vervoort's article in this issue, "ARSI, The Asymmetrical RSI" (Figure 12).
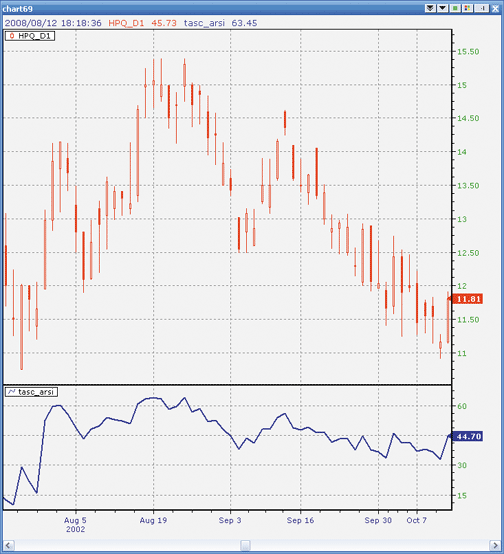
FIGURE 12: NEOTICKER, ARSI
We named the formula indicator in NeoTicker "asymmetrical RSI" (Listing 1) with one integer parameter for the number of periods that ARSI is based on. We used a different implementation than is shown in the MetaStock code given in the article's sidebar; instead of calling external indicators to calculate the rate of change in price and exponential moving averages, we use raw calculations within the same indicator to get these results. Direct calculation methods help improve indicator execution efficiency and speed.
A downloadable version of ARSI will be available at the NeoTicker blog
site (https://blog.neoticker.com).
LISTING 1
UpBar := data1-data1(1) >= 0;
$upcount := summation(UpBar, param1);
$dncount := param1-$upcount;
$upfactor := 1/($upcount*2-1);
$dnfactor := 1/($dncount*2-1);
Upmove := Upmove*(1-$upfactor)+if(UpBar>0, (data1-data1(1))*$upfactor, 0);
Dnmove := Dnmove*(1-$dnfactor)+if(UpBar=0, absvalue(data1-data1(1))*$dnfactor, 0);
$RS := Upmove/Dnmove;
plot1 := 100-(100/(1+$RS));
--Kenneth Yuen, TickQuest Inc.
www.tickquest.com
STRATASEARCH: ASYMMETRICAL RSI (ARSI)
In "ARSI, The Asymmetrical RSI" in this issue, author Sylvain Vervoort gives us a clearly defined alternative to the relative strength index. However, there is still a great deal of flexibility available when implementing this indicator. For example, to run this indicator in a backtest, we need to define our own method for measuring the divergences. Moreover, a number of supporting indicators are also recommended by the author, including candlestick patterns, Elliott waves, trendlines, and support/resistance, each of which could be implemented in a variety of ways.
In a quick test using StrataSearch's divergence() formula, the ARSI
shows some potential (Figure 13). Most parameter sets in the test were
significantly profitable, and holding periods and percentage of trades
profitable were both reasonable. If we added the use of supporting indicators,
as the author suggests, this base formula could help create a solid, profitable
system.
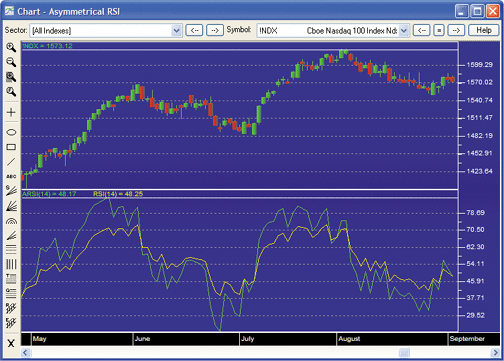
FIGURE 13: STRATASEARCH, ASYMMETRICAL RSI. As can be seen here, there are more price divergences with the ARSI (green) than with the RSI (yellow).As with all other Traders' Tips, additional information -- including plug-ins -- can be found in the Shared Area of the StrataSearch user forum. This month's plug-in contains a number of prebuilt trading rules that will allow you to include this indicator in your automated searches. Simply install the plug-in and let StrataSearch identify the benefits of using this indicator alongside other trading rules.
//***************************************
// ARSI
//***************************************
Period = parameter("Period");
UpCount = Sum(if(proc(C, 1)>=0, 1, 0), Period);
DnCount = Period-UpCount;
UpDays = LastValue(UpCount)*2-1;
UpMove = Mov(If(proc(C, 1)>=0, proc(C, 1), 0), UpDays, E);
DnDays = LastValue(DnCount)*2-1;
DnMove = Mov(If(proc(C, 1)<0, abs(proc(C, 1)), 0), DnDays, E);
RS = UpMove/DnMove;
ARSI = 100-(100/(1+RS));
--Pete Rast
Avarin Systems, Inc.
www.StrataSearch.com
ASPEN GRAPHICS: ASYMMETRICAL RSI (ARSI)
Here are the formulas needed to reproduce Sylvain Vervoort's asymmetrical relative strength index (ARSI) study in the Aspen Graphics Workstation (Figure 14).
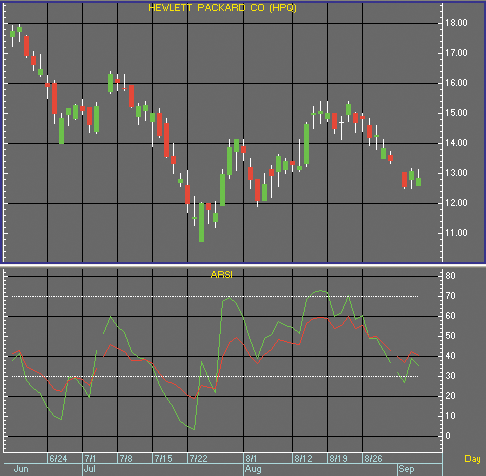
FIGURE 14: ASPEN GRAPHICS, ASYMMETRICAL RSI. Here is a demonstration of the ARSI in the Aspen Graphics workstation.We begin the ARSI by creating a formula for calculating the rate of change. This mimics MetaStock's Roc() function, which is used in Vervoort's article.
Aspen RateOfChange() Formula
RateOfChange(series, period = 14) = begin
    retval = ( ($1 - $1[period]) / $1[period] ) * 100
Next, we create a pair of formulas for tallying the up and down counts. This is done with the UpCount and DownCount formulas, respectively. We call RateOfChange() in the UpCount/DownCount formulas to get the number of periods we need for our averages.retval end
Aspen UpCount() Formula
UpCount(series, period = 14) = begin
    retval = 1
    cnt = 1
    while cnt < period do begin
        if RateOfChange($1, 1)[cnt] >= 0 then retval  = retval + 1
        cnt = cnt + 1
    end
    retval
end
Aspen DownCount() Formula
DownCount(series, period = 14) = begin
    retval = 1
    cnt = 1
    while cnt < period do begin
        if RateOfChange($1, 1)[cnt] < 0 then retval = retval + 1
        cnt = cnt + 1
    end
    retval
end
Finally, we create the ARSI formula. The ARSI formula calculates
the exponential moving averages of each day's rate of change using the
results from the UpCount() and DownCount() formulas as periods. The result
is as follows, which is the ARSI.
Aspen ARSI() Formula
ARSI(series, period = 14) = begin
    retval = nonum
    roc = RateOfChange($1, 1)
    upMove = eavg(if(roc >= 0, roc, 0), UpCount($1, period) * 2 - 1)
    dnMove = eavg(if(roc < 0, Abs(roc), 0), DownCount($1, period) * 2 - 1)
    rs = upMove/dnMove
    retval = 100 - (100 / (1 + rs))
    retval
end
These formulas and a complete page suite are available to Aspen
Graphics users at:
https://www.aspenres.com/forums/viewtopic.php?f=3&t=24
For a free trial of Aspen Graphics, please contact our sales department
at sales@aspenres.com, 800 359-1121, or visit our website at https://aspenres.com.
--Jeremiah Adams
Aspen Research Group, Ltd.
support@aspenres.com, 800 359-1121
OMNITRADER: ASYMMETRICAL RSI (ARSI)
For this month's Traders' Tip, we will provide a new indicator based on Sylvain Vervoort's article in this issue, "ARSI, The Asymmetrical RSI." The name of the indicator is "Arsi.txt." A sample chart demonstrating it can be found in Figure 15.
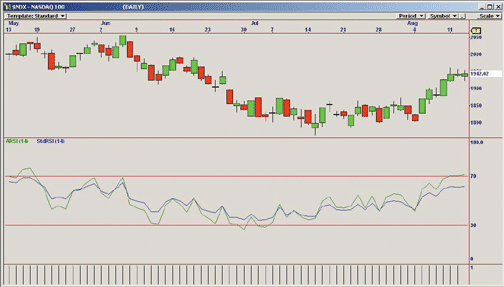
FIGURE 15: OMNITRADER, ASYMMETRICAL RSI. Here is a daily price chart of the NASDAQ index with ARSI plotted along with the standard RSI.To use this indicator, first copy the file "Arsi.txt" to the directory C:\Program Files\Nirvana\OT2008\VBA\Indicators. Next, open OmniTrader and click Edit:OmniLanguage. You should see ARSI in the indicators section of the project pane. Click "compile." Now the code is ready to use.
For more information and complete source code, visit https://www.omnitrader.com/ProSI.
#Indicator
'**************************************************************
'*   Asymmetrical Relative Strength Index (ARSI.txt)
'*     by Jeremy Williams       August 13, 2008
'*
'*    Adapted from Technical Analysis of Stocks & Commodities
'*     October 2008
'*
'*  Summary:
'*      This RSI calculates its relative strength by averaging the total
'*    number of up and down bars by their respective counts rather than a
'*    fixed period as in the standard RSI
'*
'*  Parameters:
'*  Periods -  Specifies the number of bars to use in the RSI calculation
'**************************************************************
#Param "Periods", 14, 1, 100
Dim fUpBar, fDownBar, fUpCount, fDownCount as Single
Dim fUpMove, fDownMove, fUpAvg, fDownAvg as Single
Dim fARS, fARSI as Single
Dim UpAlpha, DownAlpha As Single
fUpCount = fUpCount[1]
fDownCount = fDownCount[1]
'Set our fixed scaling and labels
SetScales(0, 100)
PlotLabel(70)
PlotLabel(30)
'Calculate the Rate of Change
If C >= C[1] then
    fUpMove = C - C[1]
    fUpBar = 1
Else
    fDownMove = Abs(C - C[1])
    fDownBar = 1
End If
'If we do not have enough bars to perform our calculations, initalize our EMAs
If Bar <= 2*Periods+1 Then
    fUpAvg = fUpAvg[1]+fUpMove/Periods
    fDownAvg = fDownAvg[1]+fDownMove/Periods
'We now have enough bars
Else
    'Count the number of up and down bars
    fUpCount = Sum(fUpBar, Periods)
    fDownCount = Sum(fDownBar, Periods)
    'Calculate up and down aplhas for EMA
    UpAlpha = 2/(2*fUpCount+2)
    DownAlpha = 2/(2*fDownCount+2)
    'Calculate EMAs for ROC
    fUpAvg = UpAlpha*fUpMove+(1-UpAlpha)*fUpAvg[1]
    fDownAvg = DownAlpha*fDownMove+(1-DownAlpha)*fDownAvg[1]

    'Calculate asymmetrical relative strength
    fARS = fUpAvg/fDownAvg
    'Calculate the indicator
    fARSI = 100-(100/(1+fARS))

    Plot("ARSI", fARSI, Green)
End If
Return fARSI
--Jeremy Williams, Trading Systems Researcher
Nirvana Systems, Inc.
www.omnitrader.com, www.nirvanasystems.com
NINJATRADER: ASYMMETRICAL RSI (ARSI)
The ARSI indicator as discussed by Sylvain Vervoort in his article in this issue, "ARSI, The Asymmetrical RSI," is available for download at www.ninjatrader.com/SC/October2008SC.zip.
Once it is downloaded, from within the NinjaTrader Control Center window, select the menu File > Utilities > Import NinjaScript and select the downloaded file. These indicators are for NinjaTrader Version 6.5 or greater. See Figure 16.
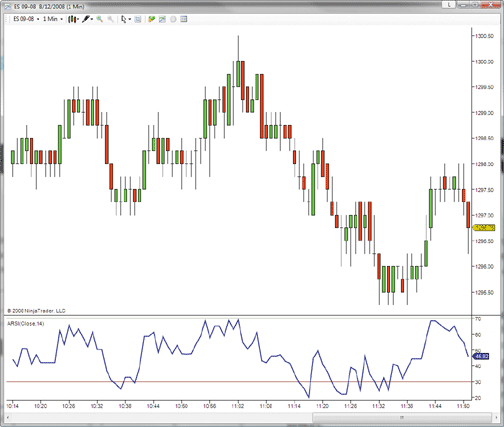
FIGURE 16: NINJATRADER, ASYMMETRICAL RSI. Here is a demonstrations of the ARSI indicator applied to a one-minute chart of the September 2008 S&P 500 emini contract.You can review the indicator's source code by selecting the menu Tools > Edit NinjaScript > Indicator from within the NinjaTrader Control Center window and selecting Arsi.
NinjaScript indicators are compiled DLLs that run native, not interpreted, which provides you with the highest performance possible.
--Raymond Deux & Ben Nachtrieb
NinjaTrader, LLC
www.ninjatrader.com
METATRADER 4: ASYMMETRICAL RSI (ARSI)
Here is some code for use in MetaTrader 4 to go with the article in
this issue, "ARSI, The Asymmetrical RSI," by Sylvain Vervoort.
//+--------
+
//|                             TASC102008 - ARSI.mq4 |
//|                         Copyright © 2008, Mistigri LLC |
//|                              https://www.mistigrifx.com |
//+--------
+
#property copyright "Copyright © 2008, Mistigri LLC"
#property link      "https://www.mistigrifx.com"
#property indicator_separate_window
#property indicator_minimum 0
#property indicator_maximum 100
#property indicator_buffers 1
#property indicator_color1 DodgerBlue
//---- input parameters
extern int Periods=14;
//---- buffers
double RSIBuffer[];
double PosBuffer[];
double NegBuffer[];
double RocUpBuffer[];
double RocDnBuffer[];
//+--------
+
//| Custom indicator initialization function                         |
//+--------
+
int init()
{
   string short_name;
   IndicatorBuffers(5);
   SetIndexBuffer(1,PosBuffer);
   SetIndexBuffer(2,NegBuffer);
   SetIndexBuffer(3,RocUpBuffer);
   SetIndexBuffer(4,RocDnBuffer);
   //---- indicator line
   SetIndexStyle(0,DRAW_LINE);
   SetIndexBuffer(0,RSIBuffer);
   SetIndexDrawBegin(0,Periods);
   //---- name for DataWindow and indicator subwindow label
   short_name="ARSI("+Periods+")";
   IndicatorShortName(short_name);
   SetIndexLabel(0,short_name);
   //---- Set indicator Levels
   SetLevelValue( 0, 30.0);
   SetLevelValue( 1, 70.0);
   SetLevelStyle( 2, 1, Gray );
   //----
   return(0);
}
//+--------
+
//| Relative Strength Index                                          |
//+--------
+
int start()
{
   int counted_bars=IndicatorCounted();
   //----
   if(Bars<=Periods) { return(0); }
   //---- initial zero
   if( counted_bars < 1 )
   for(int i=1;i<=Periods;i++) { RSIBuffer[Bars-i] = 0.0; }
   //---- Set ROC Arrays
   i=Bars-1;
   while(i>=0)
   {
      double rel=Close[i]-Close[i+1];
      if( rel >= 0 ) { RocUpBuffer[i] = rel; RocDnBuffer[i] =  0.0; }
      else           { RocUpBuffer[i] = 0.0; RocDnBuffer[i] = -rel; }
      i--;
   }
   //---- Calculate RSI
   i=Bars-Periods-1;
   if(counted_bars>=Periods) { i=Bars-counted_bars-1; }
   while(i>=0)
   {
      if(i==Bars-Periods-1)
      {
         PosBuffer[i]= iMAOnArray( RocUpBuffer, 0, Periods, 0, MODE_SMA, i );
         NegBuffer[i]= iMAOnArray( RocDnBuffer, 0, Periods, 0, MODE_SMA, i );
      }
      else
      {
         int UpCount = 0; int DnCount = 0;
         //---- Calculate Up and Dn counts
         for( int j = 0; j < Periods; j++ )
         {
            if( RocDnBuffer[i+j] != 0.0 ) { DnCount++; } else { UpCount++; }
         }
         int UpPeriods = ( UpCount*2-1 ); int DnPeriods = ( DnCount*2-1 );
         //StandardRSI formula - PosBuffer[i] = (PosBuffer[i+1]*(Periods-1)+RocUpBuffer[i])/Periods;
         //ARSI formula / Replace Wilders smoothing by Adaptive EMA
         PosBuffer[i] = iMAOnArray( RocUpBuffer, 0, UpPeriods, 0, MODE_EMA, i );
         //Standard RSI formula - NegBuffer[i] = (NegBuffer[i+1]*(Periods-1)+RocDnBuffer[i])/Periods;
         //ARSI formula / Replace Wilders smoothing by Adaptive EMA
         NegBuffer[i] = iMAOnArray( RocDnBuffer, 0, DnPeriods, 0, MODE_EMA, i );
      }
      if(NegBuffer[i] == 0.0) { RSIBuffer[i] = 0.0; }
      else            { RSIBuffer[i]=100.0-(100.0/(1+PosBuffer[i]/NegBuffer[i])); }
      i--;
   }
   return(0);
  }
//+--------
+
--Patrick S. Nouvion
admin@mistigrifx.com
www.mistigrifx.com
VT TRADER: ASYMMETRICAL RSI (ARSI)
The asymmetrical RSI as described by Sylvain Vervoort in his article in this issue, "ARSI, The Asymmetrical RSI,"is a modified, less smooth version of J. Welles Wilder's original RSI formula.
According to Vervoort's article, the ARSI's main advantages over Wilder's RSI are its ability to enter overbought and oversold territory more frequently and its ability to identify more reliable price/indicator divergences.
We'll be offering the ARSI indicator for download in our user forums.
The VT Trader code and instructions for recreating the ARSI indicator are
as follows:
The Asymmetrical RSI Indicator
1. Navigator Window>Tools>Indicator Builder>[New] button
2. In the Indicator Bookmark, type the following text for each field:
Name: TASC - 10/2008 - Asymmetrical RSI (ARSI)
Short Name: vt_ARSI
Label Mask: TASC - 10/2008 - Asymmetrical RSI (ARSI) (%Price%,%Period%) | %ARSI%
Placement: New Frame
Inspect Alias: Asymmetrical RSI
3. In the Input Bookmark, create the following variables:
[New] button... Name: Price , Display Name: ARSI Price , Type: price , Default: close
[New] button... Name: Period , Display Name: ARSI Periods , Type: integer, Default: 14
4. In the Output Bookmark, create the following variables:
[New] button...
Var Name: ARSI
Name: (ARSI)
Line Color: dark red
Line Width: slightly thicker
Line Type: solid
5. In the Horizontal Line Bookmark, create the following variables:
[New] button...
Value: +70.0000
Color: red
Width: thin
Type: dashed
[New] button...
Value: +50.0000
Color: gray
Width: thin
Type: dashed
[New] button...
Value: +30.0000
Color: red
Width: thin
Type: dashed
6. In the Formula Bookmark, copy and paste the following formula:
{Provided By: Visual Trading Systems, LLC &
Capital Market Services, LLC (c) Copyright 2008}
{Description: The Asymmetrical RSI (ARSI) Indicator}
{Notes: T.A.S.C., October 2008 - "ARSI, The Asymmetrical RSI" by Sylvain Vervoort}
{vt_ARSI Version 1.0}
UpCount:= sum(if(roc(Price,1,points)>=0,1,0),Period);
DnCount:= Period-UpCount;
UpMove:= wilders(if(roc(Price,1,points)>=0,roc(Price,1,points),0),UpCount);
DnMove:= wilders(if(roc(Price,1,points)<0,abs(roc(Price,1,points)),0),DnCount);
RS:= UpMove/DnMove;
ARSI:= 100-(100/(1+RS));
7. Click the "Save" icon to finish building the ARSI indicator.
To attach the indicator to a chart, click the right mouse button
within the chart window and then select
"Add Indicator" -> "TASC - 10/2008 - Asymmetrical Rsi (Arsi)" from the
indicator list. See Figure 17.
To learn more about VT Trader, please visit www.cmsfx.com.
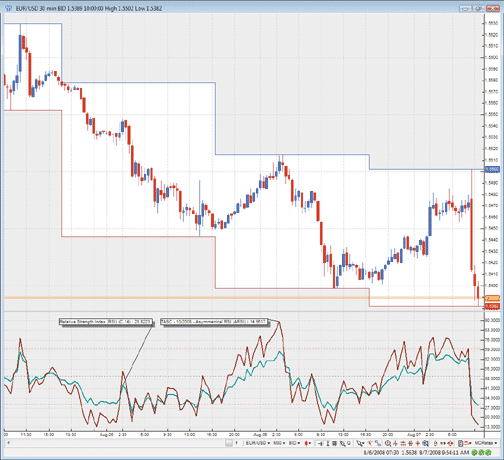
FIGURE 17: VT TRADER, ARSI. Here, the ARSI (in red) and RSI (in green) indicators are attached to a EUR/USD 30-minute candlestick chart in VT Trader.--Chris Skidmore
CMS Forex
(866) 51-CMSFX, trading@cmsfx.com
www.cmsfx.com

