TRADING STRATEGIES
Introducing Dr. Strangemarket
How I Stopped Holding And
Learned To Love The Death Cross
Check out this exit strategy, which may be what you need when a specific stock or market is weakening or bearish, compared to the (classic but not necessarily desirable) buy & hold strategy.
Traditionally, buy & hold investors have sought to buy low and sell high to maximize returns. Although this sounds attractive, there are several problems in using only this approach in the stock market. One of the most common is the round trip, where the investor buys the stock at a relatively low price, holds the stock as it goes up, continues to hold as the stock loses the gains, until it returns to the price at which it was bought.
Unfortunately, many investors have found themselves holding after the gains disappear and losses continue, hoping the stock will make a comeback. Some buy even more, regardless of the losses they are still holding, in a feeble attempt to offset the losses by buying when it’s inexpensive. This type of averaging down happens when emotions overtake logic, and it is usually for the worst.
Buy & hold approach
Look at how the buy & hold investor begins to invest in the market. First, the investor must determine the current value of the stock. Fundamental analysis of a stock is the most commonly used method to gauge market value. One of the prerequisites for fundamental analysis is that the accounting data or financial outlook that the company provides is accurate and a reflection of the company’s business status for that reporting period.
But what is the individual investor to do when the fundamental picture the company presents is untrue? How can an individual invest in a company he has concluded to be a good buy and still protect his investment from potentially inaccurate, misleading information? Is there any way for an investor to hedge against unforeseen circumstances that will negatively affect the market or stock that is part of his buy & hold investment strategy?
Implied volatility, or the estimated volatility of a securities price, sharply increased in early 2007. In fact, February 27, 2007, was the largest single-day percentage increase in the history of the Cboe volatility index (Vix). The uncertainty in the markets and perspectives regarding them make gauging the markets’ directions difficult at best. Wild swings in today’s markets make for many round trips or worse for the buy & hold investor.

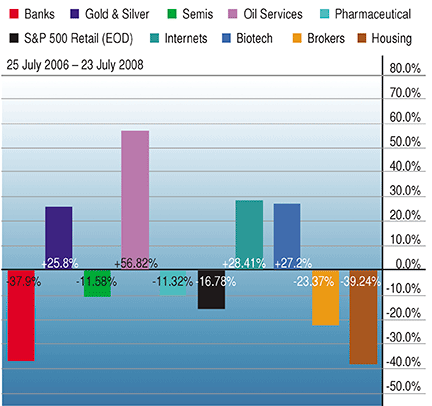
FIGURE 1: Industry Groups ($BKX, $XAU, $SOX, $OSX, $DRG, $GSPMS, $DOT, $BTK, $XBD and $HGX). The worst industry was housing ($HGX) followed by banking and brokers. Oil, gold, and tech were the best.
Technical analysis
One such example of the changing times is the housing market. Three years ago, the housing market was so hot that every Joe Schmo was getting a second mortgage as an investment. Now, the housing market is another bubble gone bust as the global credit crisis continues to unfold. Hedge funds and major financial institutions have lost out, trying to play the subprime mortgage market shell game. How could an individual investor with no inside information and limited resources possibly have protected his credit crisis—related investments?