March 2009
TRADERS’ TIPS
Here is this month’s selection of Traders’ Tips, contributed by various developers of technical analysis software to help readers more easily implement some of the strategies presented in this and other issues.
Other code appearing in articles in this issue is posted in the Subscriber Area of our website at https://technical.traders.com/sub/sublogin.asp. Login requires your last name and subscription number (from mailing label). Once logged in, scroll down to beneath the “Optimized trading systems” area until you see “Code from articles.” From there, code can be copied and pasted into the appropriate technical analysis program so that no retyping of code is required for subscribers.
You can copy these formulas and programs for easy use in your spreadsheet or analysis software. Simply “select” the desired text by highlighting as you would in any word processing program, then use your standard key command for copy or choose “copy” from the browser menu. The copied text can then be “pasted” into any open spreadsheet or other software by selecting an insertion point and executing a paste command. By toggling back and forth between an application window and the open web page, data can be transferred with ease.
This month’s tips include formulas and programs for:
- TRADESTATION: MONTE CARLO SYSTEM EVALUATION/SPECIAL K
- ESIGNAL: REVERSED MACD CROSSOVER SYSTEM
- AMIBROKER: REVERSED MACD CROSSOVER SYSTEM
- WEALTH-LAB: REVERSED MACD CROSSOVER SYSTEM
- NEUROSHELL TRADER: REVERSED MACD CROSSOVER SYSTEM
- AIQ: REVERSED MACD CROSSOVER SYSTEM
- TRADERSSTUDIO: REVERSED MACD CROSSOVER SYSTEM
- STRATASEARCH: REVERSED MACD CROSSOVER SYSTEM
- NINJATRADER: REVERSED MACD CROSSOVER SYSTEM
- TD AMERITRADE STRATEGYDESK: TRADE SYSTEM EVALUATION
- TRADE NAVIGATOR: REVERSED MACD CROSSOVER SYSTEM
- VT TRADER: REVERSED MACD CROSSOVER SYSTEM
- TRADE-IDEAS: REVERSED MACD CROSSOVER SYSTEM
- MEATSTOCK: REVERSED MACD CROSSOVER SYSTEM (Pendergast Article Code)
TRADESTATION: MONTE CARLO SYSTEM EVALUATION/SPECIAL K
Donald Pendergast’s article in this issue, “Trade System Evaluation,” describes a method for performing Monte Carlo simulations and provides a simple strategy to demonstrate the process. Strategy code in EasyLanguage is presented here.
TradeStation relies on external add-ons to perform Monte Carlo simulations of strategies. There are active discussions in our support forums on the merits of various Monte Carlo add-ons. These discussions mention the following products (not a recommendation of any particular add-on): ProSizer, @Risk, Portfolio, MC Sim, Risk Analyzer, TreeAge Pro, Market System Analyzer, and Rina. Costs for these products range from free to several thousand dollars.
Special K
Martin Pring’s article “The Special K” (Stocks & Commodities, December 2008) describes a timing indicator that seeks to identify the direction of the primary trend, along with short-term buy and sell signals and trade reversal signals. (See Figure 1.)
Special K is based on the Kst (Know Sure Thing) indicator that Pring developed in the 1990s. Special K is defined in terms of daily and weekly bars. The daily Special K, weekly Special K, and Kst code are all provided here.
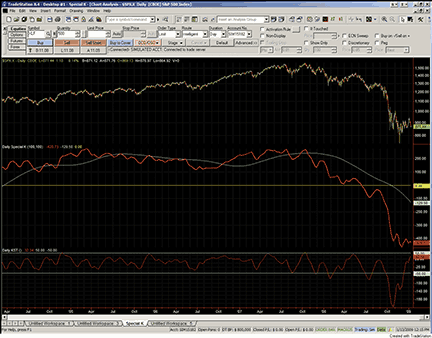
FIGURE 1: TRADESTATION, SPECIAL K AND KST.. The daily Special K and daily KST indicators are displayed on five years of S&P 500 index data. These indicators were described in Martin Pring’s December 2008 Stocks & Commodities, “The Special K.”.
To download the EasyLanguage code for this study, go to the TradeStation and EasyLanguage Support Forum (https://www.tradestation.com/Discussions/forum.aspx?Forum_ID=213). Search for the file “PringAndPendergast.eld.”
Strategy:  Pendergast Crossover

inputs:
	FastLength( 9 ),
	SlowLength( 26 ),
	MACDLength( 9 ) ;

variables:
	MACDValue( 0 ),
	XAvgValue( 0 ) ;

MACDValue = MACD( Close, FastLength, SlowLength ) ;
XAvgValue = XAverage( MACDValue, MACDLength ) ;

if XAvgValue crosses over MACDValue then
	Buy next bar market ;

if XAvgValue crosses under MACDValue then
	SellShort next bar at market ;


Indicator:  Daily Special K

inputs:  P1( 100 ), P2( 100 ) ;
variables:  SpecialK_D( 0 ), SpecialK_MA( 0 ) ;

SpecialK_D = Average( RateOfChange( Close, 10 ), 10 )
	+ Average( RateOfChange( Close, 15 ), 10 ) * 2
	+ Average( RateOfChange( Close, 20 ), 10 ) * 3
	+ Average( RateOfChange( Close, 30 ), 15 ) * 4
	+ Average( RateOfChange( Close, 50 ), 50 )
	+ Average( RateOfChange( Close, 65 ), 65 ) * 2
	+ Average( RateOfChange( Close, 75 ), 75 ) * 3
	+ Average( RateOfChange( Close, 100 ), 100 ) * 4
	+ Average( RateOfChange( Close, 195 ), 130 )
	+ Average( RateOfChange( Close, 265 ), 130 ) * 2
	+ Average( RateOfChange( Close, 390 ), 130 ) * 3
	+ Average( RateOfChange( Close, 530 ), 195 ) * 4  ;

SpecialK_MA = Average( Average( SpecialK_D, P1 ), P2 ) ;

Plot1( SpecialK_D, “SpecialK_D” ) ;
Plot2( SpecialK_MA, “SpecialK_MA” ) ;
Plot3( 0, “ZeroLine” ) ;


Indicator:  Weekly Special K
inputs:  P1( 52 ), P2( 26 ) ;
variables:  SpecialK( 0 ), SpecialK_MA( 0 ) ;

SpecialK = XAverage( RateOfChange( Close, 4 ), 4 )
	+ XAverage( RateOfChange( Close, 5 ), 5 ) * 2
	+ XAverage( RateOfChange( Close, 6 ), 6 ) * 3
	+ XAverage( RateOfChange( Close, 8 ), 8 ) * 4
	+ XAverage( RateOfChange( Close, 10 ), 10 )
	+ XAverage( RateOfChange( Close, 13 ), 13 ) * 2
	+ XAverage( RateOfChange( Close, 15 ), 15 ) * 3
	+ XAverage( RateOfChange( Close, 20 ), 20 ) * 4
	+ XAverage( RateOfChange( Close, 39 ), 26 )
	+ XAverage( RateOfChange( Close, 52 ), 26 ) * 2
	+ XAverage( RateOfChange( Close, 78 ), 26 ) * 3
	+ XAverage( RateOfChange( Close, 104 ), 39 ) * 4 ;

SpecialK_MA = Average( Average( SpecialK, P1 ), P2 ) ;

Plot1( SpecialK, “SpeclK” ) ;
Plot2( SpecialK_MA, “SpeclK_MA” ) ;
Plot3( 0, “ZeroLine” ) ;


Indicator: Daily KST
variables:  DKST( 0 ) ;

DKST = Average( RateOfChange( Close, 10 ), 10 )
	+ Average( RateOfChange( Close, 15 ), 10 ) * 2
	+ Average( RateOfChange( Close, 20 ), 10 ) * 3
	+ Average( RateOfChange( Close, 30 ), 15 ) * 4 ;

Plot1( DKST, “Daily KST” ) ;
Plot2( 50, “50” ) ;
Plot3( -50, “-50” ) ;
This article is for informational purposes. No type of trading or investment recommendation, advice, or strategy is being made, given, or in any manner provided by TradeStation Securities or its affiliates.
BACK TO LIST
ESIGNAL: REVERSED MACD CROSSOVER SYSTEM
For this month’s Traders’ Tip, we’ve provided the eSignal formula, Macd_RevCrossover.efs, based on the formula code from Donald Pendergrast’s article in this issue, “Trade System Evaluation.”
The formula simply plots the Macd and Macd signal indicators (Figure 2). The formula contains parameters that may be configured through the Edit Studies option to change the fast length, slow length, and smoothing. The study is a long-only system that colors the price bars lime green to indicate a long position and black when no position is in force. The formula is also compatible for backtesting in the Strategy Analyzer.
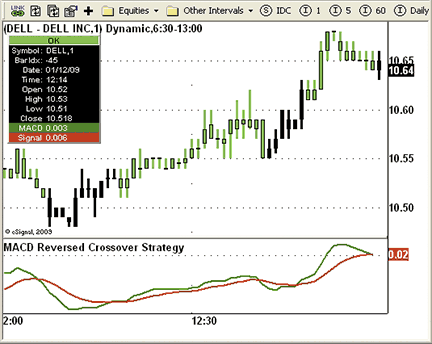
FIGURE 2: eSIGNAL, REVERSED MACD CROSSOVER. This sample eSignal chart shows the MACD and MACD signal indicators. The study is a long-only system that colors the prices bars lime green to indicate a long position and black when no position is in force.
To discuss this study or download a complete copy of the formula code, please visit the Efs Library Discussion Board forum under the Forums link at www.esignalcentral.com or visit our Efs KnowledgeBase at www.esignalcentral.com/support/kb/efs/. The eSignal formula scripts (Efs) are also available for copying and pasting from the Stocks & Commodities website at www.traders.com.
 /*********************************
Provided By:
    eSignal (Copyright c eSignal), a division of Interactive Data
    Corporation. 2008. All rights reserved. This sample eSignal
    Formula Script (EFS) is for educational purposes only and may be
    modified and saved under a new file name.  eSignal is not responsible
    for the functionality once modified.  eSignal reserves the right
    to modify and overwrite this EFS file with each new release.

Description:
    MACD Reversed Crossover Strategy, by Donald W. Pendergast Jr.

Version:            1.0  01/08/2009

Formula Parameters:                     Default:
    Fast Length                         12
    Slow Length                         26
    Smoothing                           9

Notes:
    The related article is copyrighted material. If you are not
    a subscriber of Stocks & Commodities, please visit www.traders.com.

**********************************/

var fpArray = new Array();
var bInit = false;
var bVersion = null;

function preMain() {
    setPriceStudy(false);
    setShowTitleParameters( false );
    setStudyTitle(“MACD Reversed Crossover Strategy”);
    setColorPriceBars(true);
    setDefaultPriceBarColor(Color.black);
    setCursorLabelName(“MACD”, 0);
    setCursorLabelName(“Signal”, 1);
    setDefaultBarFgColor(Color.green, 0);
    setDefaultBarFgColor(Color.red, 1);
    setDefaultBarThickness(2, 0);
    setDefaultBarThickness(2, 1);


    var x=0;
    fpArray[x] = new FunctionParameter(“FastLength”, FunctionParameter.NUMBER);
	with(fpArray[x++]){
        setName(“Fast Length”);
        setLowerLimit(1);
        setDefault(12);
    }
    fpArray[x] = new FunctionParameter(“SlowLength”, FunctionParameter.NUMBER);
	with(fpArray[x++]){
        setName(“Slow Length”);
        setLowerLimit(1);
        setDefault(26);
    }
    fpArray[x] = new FunctionParameter(“Smoothing”, FunctionParameter.NUMBER);
	with(fpArray[x++]){
        setName(“Smoothing”);
        setLowerLimit(0);
        setDefault(9);
    }
}

var xMACD = null;
var xSignal = null;

function main(FastLength, SlowLength , Smoothing) {

    if (bVersion == null) bVersion = verify();
    if (bVersion == false) return;

    if (getCurrentBarIndex() == 0) return;

    if ( bInit == false ) {
        xMACD = macd(FastLength, SlowLength, Smoothing);
        xSignal = macdSignal(FastLength, SlowLength, Smoothing);
        bInit = true;
    }

    if (xSignal.getValue(-1) == null) return;

    if(xSignal.getValue(-2) >= xMACD.getValue(-2) &&
       xSignal.getValue(-1) < xMACD.getValue(-1) && !Strategy.isLong()) {
		Strategy.doLong(“Long”, Strategy.MARKET, Strategy.THISBAR);
    }

	if(xSignal.getValue(-1) > xMACD.getValue(-1) && Strategy.isLong()) {
		Strategy.doSell(“Exit Long”, Strategy.MARKET, Strategy.THISBAR);
	}

	if(Strategy.isLong())
		setPriceBarColor(Color.lime);
	else setPriceBarColor(Color.black);

	return new Array(xMACD.getValue(0), xSignal.getValue(0));
}

function verify() {
    var b = false;
    if (getBuildNumber() < 779) {
        drawTextAbsolute(5, 35, “This study requires version 8.0 or later.”,
            Color.white, Color.blue, Text.RELATIVETOBOTTOM|Text.RELATIVETOLEFT|Text.BOLD|Text.LEFT,
            null, 13, “error”);
        drawTextAbsolute(5, 20, “Click HERE to upgrade.@URL=https://www.esignal.com/download/default.asp”,
            Color.white, Color.blue, Text.RELATIVETOBOTTOM|Text.RELATIVETOLEFT|Text.BOLD|Text.LEFT,
            null, 13, “upgrade”);
        return b;
    } else {
        b = true;
    }
    return b;
}
BACK TO LIST
AMIBROKER: REVERSED MACD CROSSOVER SYSTEM
In “Trade System Evaluation” in this issue, author Donald Pendergast suggests that realistic system performance evaluation can be achieved by means of series of Monte Carlo tests that randomly pick candidates for trading.
Implementing such random-pick series of tests is easy in AmiBroker, thanks to its built-in ranking and scoring algorithm that allows you to pick the trades based on user-defined scores. All signals are sorted by position score on bar-by-bar basis, and only top-N signals are traded.
All this happens using the standard AmiBroker portfolio backtester, and it does not require any external expensive tools.
Implementing random picks requires adding just one line to your existing system code (PositionScore = 100 * mtRandomA();). It is worth noting that AmiBroker features a built-in high-grade random number generator — the Mersene Twister — which is superior to standard generators found in other software. The choice of a high-quality random number generator is essential in Monte Carlo applications.
A ready-to-use formula for the article is presented in Listing 1. To perform series of tests using random-picking, choose Tools->Optimize from the Formula Editor menu. The result will be the list of performance statistics for each individual step of the optimization that is equivalent to one Monte Carlo test run, as shown in Figure 3.
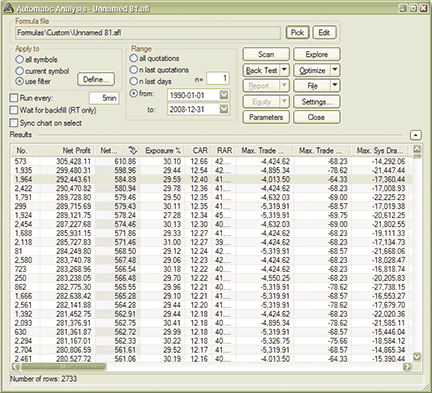
FIGURE 3: AMIBROKER, MONTE CARLO SIMULATION. This list shows the results of Monte Carlo test runs of the system presented in Donald Pendergast’s article sorted by Net % Profit. Such result lists can be copied and pasted into Excel (by just pressing Ctrl+C) and from there, one can easily create a distribution chart of any system metric using Tools->Data Analysis, “histogram” option.
Before testing, you may need to adjust your system test settings and adjust the filter to match the basket you want to test on. It is worth noting that the author’s claim that Monte Carlo tests gives realistic results, in this case, is not true, simply because he ignored the single, most important factor influencing the results — the survivorship bias. When testing for long periods of time (as in the period used in the article from 1990 until the present), one must account for delisted stocks and changes in index component listing over the course of years when a test is performed. Failing to do that means the tests are performed on winners (survivors) only who stayed in business through the years-long period, and this generates a large positive bias on the results. Once delisted stocks are included, the results drop significantly.
Fortunately, it’s possible to account for delisted stocks using AmiBroker with data sources such as PremiumData that include historical data for delisted stocks. To do this, one needs to switch active watchlists every time the Nasdaq 100 index is modified (see https://www.amibroker.com/members/ for details).
 LISTING 1

// General-purpose MC part
HowManyMCSteps = 20000; // adjust that to change the number of MC tests

PositionScore = 100 * mtRandomA();
// that is single-line that causes random picking of signals

Step = Optimize(“Step”, 1, 1, HowManyMCSteps , 1 );
// this is dummy variable, not used below

// The trading system itself
// ( you may enter your own system below instead of one from the article )

NumPos = 8; // maximum number of open positions
SetOption(“MaxOpenPositions”, NumPos );
SetPositionSize( GetOption(“InitialEquity”) / NumPos, spsValue );
// as in the article - no compounding of profits
// SetPositionSize( 100 / NumPos, spsPercentOfEquity );
// uncomment this for compounding profits

// signals
s = Signal( 12, 26, 9 );
m = MACD( 12, 26 );
Buy = Cross( s, m );
Sell = Cross( m, s );

SetTradeDelays( 1, 1, 1, 1 ); // trade with one bar delay on open price
BuyPrice = Open;
SellPrice = Open;
BACK TO LIST
WEALTH-LAB: REVERSED MACD CROSSOVER SYSTEM
It’s not at all common to encounter a strategy that’s profitable when reversing the entry and exit signals, but simplicity and metrics generated by the reverse Macd strategy (described in Donald Pendergast’s article in this issue, “Trade System Evaluation”) merit further investigation.
Figure 4 shows the results from a Monte Carlo lab “Trade Scramble” using the results from a weekly simulation from 1990. We found that running the strategy with weekly data tended to increase profit and reduce drawdown — another uncommon combination! Tradability may be further increased by installing a 20% stop-loss, corresponding to a 2.4% max drawdown per position at 12% of equity sizing.
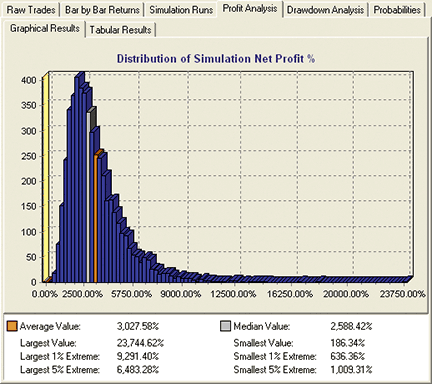
FIGURE 4: WEALTH-LAB, MONTE CARLO SIMULATION. Shown here is a Monte Carlo Lab Trade Scramble of weekly simulated trades, with no options selected.
Since the Nasdaq 100 constituents have had a more than 200% turnover since 1995, it’s probably worthwhile to revisit this strategy with a dynamic WatchList that represents the current index.
 WealthScript code (version 3/4):

var Bar, macdPane, hMACD, havgMACD: integer;
macdPane := CreatePane( 100, true, true );
hMACD := MACDSeries( #Close );
havgMACD := EMASeries( hMACD, 9 );
PlotSeries( hMACD, macdPane, #Maroon, #Thick );
PlotSeries( havgMACD, macdPane, #Black, #Thick );

for Bar := 80 to BarCount - 1 do
begin
  if LastPositionActive then
  begin
    if CrossUnder( Bar, havgMACD, hMACD ) then
      SellAtMarket( Bar + 1, LastPosition, ‘’ );
  end
  else if CrossOver( Bar, havgMACD, hMACD ) then
    BuyAtMarket( Bar + 1, ‘’ );
end;
BACK TO LIST
NEUROSHELL TRADER: REVERSED MACD CROSSOVER SYSTEM
The reversed Macd crossover system described by Donald Pendergast in his article in this issue, “Trade System Evaluation,” can be implemented in NeuroShell Trader by combining a few of NeuroShell Trader’s 800+ indicators and trading strategy wizard.
To recreate the system, select “New Trading Strategy...” from the Insert menu and enter the following formula in the appropriate locations of the Trading Strategy Wizard:
Buy long when all of the following conditions are true:
CrossAbove( MACDSignal(Close,9,12,16), MACD(Close,12,26) )

Sell long when all of the following conditions are true:
CrossBelow( MACDSignal(Close,9,12,16), MACD(Close,12,26) )
You can apply the system to as many ticker symbols as desired, in this case the entire Nasdaq 100, by selecting “Add/Remove Chart Pages...” from the Format menu. If you have NeuroShell Trader Professional, you can also choose whether the system parameters should be optimized per ticker symbol or across the entire portfolio of ticker symbols. After backtesting the trading strategy, use the “Detailed Analysis...” button to view the backtest and trade-by-trade statistics for the strategy.
Users of NeuroShell Trader can go to the Stocks & Commodities section of the NeuroShell Trader free technical support website to download a copy of this or any past Traders’ Tips. See Figure 5 for a sample chart.
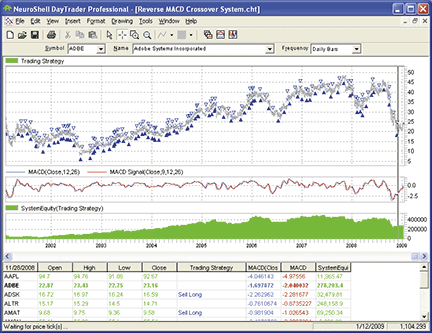
FIGURE 5: NeuroShell, REVERSED MACD CROSSOVER SYSTEM. Here is the reversed MACD crossover system in NeuroShell Trader.
BACK TO LIST
AIQ: REVERSED MACD CROSSOVER SYSTEM
The Aiq code for the reversed Macd crossover system described in Donald Pendergast’s article in this issue, “Trade System Evaluation,” is shown here. In the article, Pendergast uses Monte Carlo testing on a portfolio of the Nasdaq 100 stocks.
The suggested system does not include a sorting algorithm to choose trades when there are more trades than we can take on any single day based on our capitalization and position sizing rules. Instead, the author suggests that we randomly choose the trades that are to be taken using Monte Carlo analysis, which samples trades without replacement. In addition, from the description in the article, it appears that the order of the trades is not randomized. In order to apply this type of Monte Carlo analysis to a system, I will make several assumptions regarding the characteristics of the system and how the testing will proceed:
- The system must generate more trades than can be taken when capitalization is applied,
- Trades are not reordered, samples are taken without replacement, and
- A sorting algorithm is not part of the system.
If we had a system where there were no excess trades and all trades were taken, or if our system uses a sorting algorithm to choose trades, then the Monte Carlo analysis would yield all the same results and would be of no analytical value. For the simple system used for illustration purposes, since the trades are entered the next day at market, as a system developer, I would never randomly choose the trades but would add an algorithm, such as sorted rate of change or relative strength, to choose the trades to take. For systems that do not meet the three requirements, it would be better to use the bootstrap method of sampling, where trades are replaced and hence can be chosen more than one time. By sampling with replacement, we could generate multiple equity curves with different total profit and drawdown amounts, even with systems that take all trades generated.
This analysis might be useful for more complex systems that use stops to enter. In this case, we can’t use a sorting algorithm in backtesting because we don’t know which stop orders will be hit the next day after the setup conditions are true. In any case, we can perform an analysis similar to the one run by Pendergast using a free add-in program called “TradeIt!” that is specifically designed to work with the Aiq software. In Figure 6, I used the add-in program to generate 20 equity curves running the system on the Nasdaq 100 list of stocks. The equity curve graphic is helpful in visually seeing how much variance there is between the possible equity runs. The software also produces a numerical report as shown in the table in Figure 7.
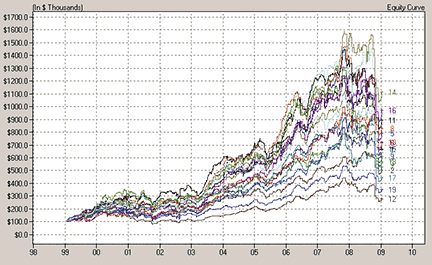
FIGURE 6: AIQ, REVERSED MACD CROSSOVER. Shown here are 20 equity curves produced by the reverse MACD system that were generated by randomly choosing which trades to take when there were more trades than could be taken.
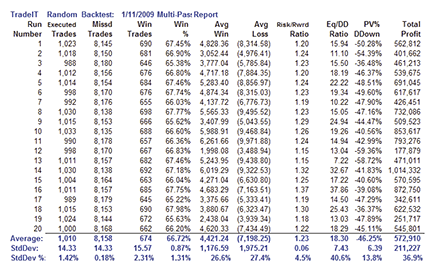
FIGURE 7: AIQ, ANALYSIS OF REVERSED MACD CROSSOVER EQUITY CURVES. This table shows a numerical summary and statistical analysis of the 20 equity curves shown in Figure 6.
The code can be downloaded from the Aiq website at www.aiqsystems.com and also from www.TradersEdgeSystems.com/traderstips.htm.
!! TRADE SYSTEM EVALUATION
! Author: Donald W. Pedergast Jr., TASC March 2009
! Coded by: Richard Denning
! www.TradersEdgeSystems.com

C 	is [close].
MACD 	is expavg(C,12) - expavg(C,26).
MACDsig is expavg(MACD,9).
! LONG ENTRY RULE FOR INVERSE MACD CROSS OVER (LE):
LE 	if MACD < MACDsig and valrule(MACD > MACDsig,1).

! LONG EXIT RULE FOR INVERSE MACD CROSS OVER (LX):
LX	if MACD > MACDsig and valrule(MACD < MACDsig,1).
BACK TO LIST
TRADERSSTUDIO: REVERSED MACD CROSSOVER SYSTEM
The TradersStudio code for the reversed Macd crossover system presented in the article in this issue, “Trade System Evaluation” by Donald Pendergast, is given here.
Although Pendergast applies Monte Carlo testing on a portfolio of the Nasdaq 100 stocks, I wanted to try the Monte Carlo approach as it might apply to testing the reverse Macd system on futures. I loaded a portfolio of futures that included two of the more liquid markets from each of the futures sectors. I then ran the system and examined the results on a market-by-market basis. I should note that in the TradersStudio code provided here, I modified the system so that it can trade long or short or both based the input “longOnly” (see the notes at top of the code listing).
In my tests, I used both long and short trading combined. Most of the futures markets that I tested showed net losses for the test period from November 2002 to January 2009 with the default Macd parameters of 12,26,9. One of the markets that showed a profit was heating oil. I decided to work with just this market. With a single-market system and with futures trading in general, we usually design the system to take all the trades that the system generates (after filtering), so the type of test that Pendergast performed is not applicable to futures testing.
A similar type of test using the Monte Carlo approach is to sample drawdowns for the purpose of setting a system profile and setting realistic expectations. I ran a parameter-robustness test on heating oil by optimizing the three Macd parameters over the in-sample test period of November 2002 to January 2009. I concluded that the system was robust for heating oil because 93% of the optimization sets were profitable and because it also passed other parameter-robustness tests.
In normal system development, I would have run a walk-forward test using TradersStudio’s built-in walk-forward processor, but this was omitted due to a shorter-than-normal publishing deadline. Instead, I just used one of the better parameter sets and proceeded to run several Monte Carlo randomizations to give me an idea of the maximum drawdown. TradersStudio comes with a preprogrammed macro that does Monte Carlo analysis on drawdowns.
In addition, any other type of sampling technique, such as bootstrapping (sampling with replacement), can be programmed with the macro scripting language. I made a few modifications to the built-in macro script for Monte Carlo drawdown analysis so as to output additional statistics. The modified macro script code is not shown here but will be posted to the websites listed at the end of this Traders’ Tip.
In Monte Carlo analysis, there is the question of how many runs are sufficient. To answer this question, I simply ran several tests with different run lengths as shown in Figure 8. Although 20,000 runs are more than is needed, I ran the rest of the analysis with 20,000 as there is no harm in using too many runs.
Another important factor in correctly analyzing drawdown is the trade sampling chunk or serial correlation sample size. What we are doing in this type of analysis is to take a group of trades in the original order that they occurred and then reorganize the order of the chunks. If you do not sample chunks of trades, as is done in many Monte Carlo–type analyses, you destroy any serial correlation that may exist in the trading system. Using an inappropriate chunk size may cause inaccurate results that are not reliable. To solve this problem, the macro within TradersStudio has a chunk or sample-length variable that can be changed to suit the system being tested. If the system has a tendency for wins to follow wins, then the sample size would need to be larger. The bottom half of Figure 8 shows the effect of running the analysis with varying chunk or sample length using a run size of 20,000.
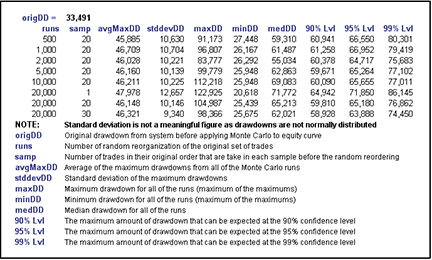
FIGURE 8: TRADERSTUDIO, ANALYSIS OF REVERSED MACD CROSSOVER. Here are resulting statistics for a variety of Monte Carlo tests on the reversed MACD system as applied to heating oil futures contract for the period November 2002 to January 2009.
In Figure 9, I show the drawdown distribution graph that results from using a sample size of 20 and 20,000 runs. Additional graphs for other sample sizes will be posted to the websites listed at the end of this tip. As the sample size is increased, the maximum drawdown at the various confidence levels starts to approach the drawdown from the original trades order. It appears that using too small of a sample size will overstate the maximum drawdown and might cause one to reject a system that has potential. Further research is needed to determine the best method of finding the appropriate sample size.
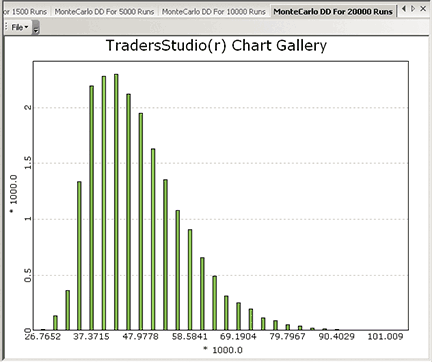
FIGURE 9: TRADERSTUDIO, REVERSED MACD CROSSOVER SYSTEM. Here is a sample drawdown distribution using a sample size of 20 with 20,000 random reorganizations of the equity curve for the reversed MACD system as applied to heating oil futures contract for the period November 2002 to January 2009.
The main benefit of this analysis is to provide a down-to-earth expectation of what the system might do in real trading regarding the risk of account drawdown and also to provide a shutdown point should the maximum drawdown exceed the confidence level chosen.
This code can be downloaded from the TradersStudio website at www.TradersStudio.com ->Traders Resources->FreeCode and also from www.TradersEdgeSystems.com/traderstips.htm.
‘ TRADE SYSTEM EVALUATION
‘ Author: Donald W. Pedergast Jr., TASC March 2009
‘ Coded by: Richard Denning
‘ www.TradersEdgeSystems.com

Sub REVERSED_MACD(longOnly,useEquisMACD,macdFastLen,macdSlowLen,macdSigLen)
‘ if longOnly = 1 then only the long side is traded
‘ if longOnly = -1 then only the short side is traded
‘ if longOnly = 0 then both long and short side is traded
‘ if useEquisMACD = 1 and inputs = C then
    ‘fast=0.15, slow=0.075 will be used for the inputs
    ‘and the MACD will match the built-in MACD from Metastock/Equis
Dim myMACD As BarArray
Dim sigMACD As BarArray
If useEquisMACD = 1 Then
    myMACD = MACD_EQUIS(C, 0.15, 0.075)
Else
    myMACD = MACD(C,macdFastLen,macdSlowLen,0)
End If
sigMACD = XAverage(myMACD, macdSigLen, 0)

If longOnly > 0 Then
    If CrossesUnder(myMACD,sigMACD,0) Then Buy(“LE”,1,0,Market,Day)
    If CrossesUnder(sigMACD,myMACD,0) Then ExitLong(“SE”,””,1,0,Market,Day)
Else If longOnly < 0 Then
    If CrossesUnder(sigMACD,myMACD,0) Then Sell(“SE”,1,0,Market,Day)
    If CrossesUnder(myMACD,sigMACD,0) Then ExitShort(“SX”,””,1,0,Market,Day)
Else
    If CrossesUnder(myMACD,sigMACD,0) Then Buy(“LE”,1,0,Market,Day)
    If CrossesUnder(sigMACD,myMACD,0) Then Sell(“SE”,1,0,Market,Day)
End If
End If
‘custom report to show quick summary of results by market:
    marketbreakdown2()
End Sub
BACK TO LIST
STRATASEARCH: REVERSED MACD CROSSOVER SYSTEM
While the Macd crossover trading system used in Donald Pendergast’s article in this issue, “Trade System Evaluation,” may be a rather simple example, Pendergast brings up two very good points about trading system development. The first is that there are a variety of ways of examining the performance of a trading system, of which Monte Carlo simulations are just one. Many traders also look at the surrounding parameter sets of the formulas to ensure the system is robust, while others like to run a full walk-forward analysis for additional confirmation. StrataSearch users can examine any of these types of analyses.
The second point Pendergast brings up is the surprising success of the reversed Macd when compared to the traditional Macd. When the automated search functionality in StrataSearch was first developed, trading rules were initially organized into their traditional roles (that is, long and short usage). What we discovered, however, is that there are many trading rules that perform better when they are similarly reversed. Thus, most trading rules in StrataSearch are no longer designated as long or short only, allowing users to test a variety of traditional and reversed usages.
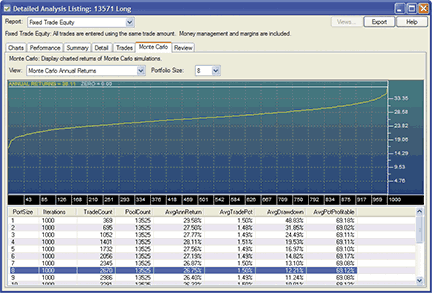
FIGURE 10: STRATASEARCH, TRADE SYSTEM EVALUATION. As shown by Donald Pendergast in his article, the Monte Carlo simulations for his MACD reversed crossover system were profitable 100% of the time.
As with all our other Traders’ Tips, additional information, including plug-ins, can be found in the Shared Area of the StrataSearch user forum. This month’s plug-in contains trading rules based on both traditional and reversed Macd implementations. Simply install the plug-in and let StrataSearch identify which works best, and which supplemental trading rules work best alongside the Macd.
//***************************************************************************
// MACD REVERSED CROSSOVER SYSTEM
//***************************************************************************
Entry String: CrossBelow(MACD(), mov(MACD(),9,e))
Exit String: CrossAbove(MACD(), mov(MACD(),9,e))
BACK TO LIST
NINJATRADER: REVERSED MACD CROSSOVER SYSTEM
The Macd reversed crossover system as discussed in “Trade System Evaluation” by Donald Pendergast in this issue has been implemented as a sample strategy available for download at www.ninjatrader.com/SC/March009SC.zip.
Once downloaded, from within the NinjaTrader Control Center window, select the menu File > Utilities > Import NinjaScript and select the downloaded file. This strategy is for NinjaTrader version 6.5 or greater.
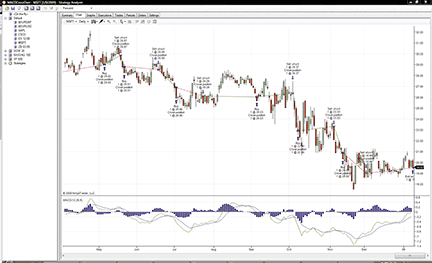
FIGURE 11: NINJATRADER, REVERSED MACD CROSSOVER. This NinjaTrader screenshot shows the MACD reversed crossover strategy backtested in the NinjaTrader Strategy Analyzer.
You can review the strategy’s source code by selecting the menu Tools > Edit NinjaScript > Strategy from within the NinjaTrader Control Center window and selecting “MacdCrossOver.”
NinjaScript strategies are compiled Dlls that run native, not interpreted, which provides you with the highest-performance possible.
BACK TO LIST
TD AMERITRADE STRATEGYDESK: TRADE SYSTEM EVALUATION
In this issue, author Donald Pendergast discusses the evaluation of trading strategies in his article “Trade System Evaluation.” To demonstrate the metrics provided in StrategyDesk, we’ll set up and run the Macd crossover strategy discussed in the article.
In the article, Pendergast bases his analysis on a simple Macd crossover formula that shows positive results. It’s a simple crossover, but reversed from the more common iteration so that the entry occurs when the Macd crosses below the zero line with the exit occurring when the Macd crosses back above the zero line. In addition, it should be noted that the formula waits until the next day’s open to perform the entry or exit.
Here is the syntax for this in StrategyDesk:
	Entry: MACD[Diff,Close,12,26,9,D,1] < 0 AND MACD[Diff,Close,12,26,9,D,2] >= 0

	Exit: MACD[Diff,Close,12,26,9,D,1] > 0 AND MACD[Diff,Close,12,26,9,D,2] <= 0
We ran this formula in StrategyDesk on the current list of Nasdaq 100 securities between January 1, 2000, and December 31, 2008. Based on $10,000 entries with no reinvesting and including commissions, we received the following results:
	$624,623 net profit
	67.47% winning trades
	Net average trade profit of $79.18
This first iteration was run with no cap on portfolio size, basically utilizing a never-ending stream of cash. Using the portfolio-backtesting capabilities in StrategyDesk, we re-ran this experiment using the same variables as above, but on a portfolio size of $100,000, reinvesting gains/losses this time, and assuming no margin. Let’s see how the results changed:
	$233,890 net profit
	67.12% winning trades
	Net average trade profit of $70.30
(See Figure 12 for backtesting results.)
The main difference here is that using a limited, not unlimited, portfolio size will only allow a certain amount of positions at one time.
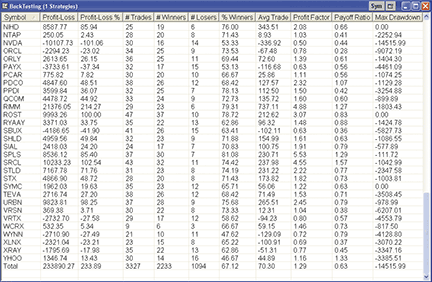
FIGURE 12: TD AMERITRADE, REVERSED MACD CROSSOVER. Here are the backtesting results for the strategy.
If you have questions about this formula or functionality, please call TD Ameritrade’s StrategyDesk help line free of charge at 800 228-8056 between the hours of 8 a.m. and 8 p.m. ET Monday through Friday, or access the Help Center via the StrategyDesk application. StrategyDesk is a downloadable application free for all TD Ameritrade clients. Regular commission rates apply.
This article and accompanying illustrative graphics are for informational purposes only. No type of trading or investment recommendation, advice, or strategy is being made, given, or in any manner provided by TD Ameritrade or StrategyDesk.
BACK TO LIST
TRADE NAVIGATOR: REVERSED MACD CROSSOVER SYSTEM
The Macd reversed crossover system discussed in Donald Pendergast’s article in this issue, “Trade System Evaluation,” is easy to recreate and test in Trade Navigator.
First, we set up two functions: Go to the Trader’s Toolbox and select the Functions tab. Click on the New button and type in the following code for Macd reversed crossover long entry:
Crosses Above (MovingAvgX (MACD (Close , Fast period , Slow period ,
False) , 9) , MACD (Close , Fast period , Slow period ,
False)).1
Click on the Save button, type a name for the function, then click the OK button to save the function.
To set up the Macd reversed crossover short entry function, repeat the steps above using the following code:
Crosses Above (MACD (Close , Fast period , Slow period ,
False) , MovingAvgX (MACD (Close , Fast period , Slow period
, False) , 9)).1
After you have created the two functions, go to the Strategies tab in the Trader’s Toolbox. Click on the New button. Click the New Rule button. To create the long entry rule, type the following code:
IF MACD Reversed Crossover Long Entry (Fast period , Slow period)
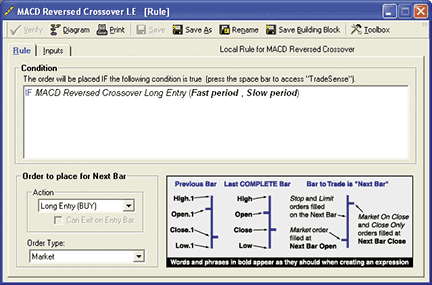
FIGURE 13: Trade Navigator, REVERSED MACD CROSSOVER. Here is the rule setup in Trade Navigator.
Set the Action to “Long Entry (Buy)” and the Order Type to “Market” (Figure 13). Click on the Save button. Type a name for the rule and then click the OK button. Repeat these steps for the short entry rule using the following code:
IF MACD Reversed Crossover Short Entry (Fast period , Slow period)
Set the Action to “Short Entry (Sell)” and the Order Type to “Market.” Be sure to have the Allow Entries to Reverse option checked on the Settings tab on the Strategy screen.
Save the strategy by clicking the Save button, typing a name for the strategy, and then clicking the OK button.
You can test your new strategy by clicking the Run button to see a report, or you can apply the strategy to a chart for a visual representation of where the strategy would place trades over the history of the chart.
Genesis Financial Technologies has provided this strategy as a special downloadable file for Trade Navigator. Click on the blue phone icon in Trade Navigator, select Download Special File, type “SC0309,” and click on the Start button.
BACK TO LIST
VT TRADER: REVERSED MACD CROSSOVER SYSTEM
Our Traders’ Tip is inspired by “Trade System Evaluation” by Donald Pendergast in this issue. In the article, Pendergast uses a reversed Macd crossover system to discuss using the Monte Carlo method of backtesting a trading system.
We’ll be offering the reversed Macd crossover trading system for download in our client forums. The VT Trader instructions for creating the sample trading system are as follows:
Sample Trading System for the Reversed MACD Crossover System
- Navigator Window>Tools>Trading Systems Builder>[New] button
- In the Indicator Bookmark, type the following text for each field:
Name: TASC TASC - 03/2009 - Reversed MACD Crossover System
Short Name: tasc_RevMACD
Label Mask: TASC - 03/2009 - Reversed MACD Crossover System (MACD: %Pr%,%pershort%,%perlong%,
%maTp%,%Sig%,%TpS%)
- In the Input Bookmark, create the following variables:
[New] button... Name: Pr , Display Name: MACD Price , Type: price , Default: close [New] button... Name: perShort , Display Name: MACD Short MA Periods , Type: integer , Default: 12 [New] button... Name: perLong , Display Name: MACD Long MA Periods , Type: integer, Default: 26 [New] button... Name: maTp , Display Name: MACD Short / Long MA Type , Type: MA type , Default: Exponential [New] button... Name: Sig , Display Name: MACD Signal MA Periods , Type: integer, Default: 9 [New] button... Name: TpS , Display Name: MACD Signal MA Type , Type: MA type , Default: Exponential - In the Output Bookmark, create the following variables:
[New] button... Var Name: Fast Name: MACD (Fast Line) * Checkmark: Indicator Output Select Indicator Output Bookmark Color: blue Line Width: thin Line Style: solid Placement: Additional Frame 1 [OK] button... [New] button... Var Name: Signal Name: MACD (Signal Line) * Checkmark: Indicator Output Select Indicator Output Bookmark Color: red Line Width: thin Line Style: solid Placement: Additional Frame 1 [OK] button... [New] button... Var Name: OsMA Name: MACD (Histogram) * Checkmark: Indicator Output Select Indicator Output Bookmark Color: green Line Width: thin Line Style: histogram Placement: Additional Frame 1 [OK] button... [New] button... Var Name: LongSignal Name: Long Signal Description: Displays a buy signal when the Signal Line crosses above the Fast Line * Checkmark: Graphic Enabled * Checkmark: Alerts Enabled Select Graphic Bookmark Font […]: Up Arrow Size: Medium Color: Blue Symbol Position: Below price plot Select Alerts Bookmark Alert Message: Long signal detected! The MACD Signal Line crossed above MACD Fast Line. Radio Button: Standard Sound Standard Sound Alert: others.wav [OK] button... [New] button... Var Name: ShortSignal Name: Short Signal Description: Displays a sell signal when the Signal Line crosses below the Fast Line * Checkmark: Graphic Enabled * Checkmark: Alerts Enabled Select Graphic Bookmark Font […]: Down Arrow Size: Medium Color: Red Symbol Position: Above price plot Select Alerts Bookmark Alert Message: Short signal detected! The MACD Signal Line crossed below MACD Fast Line. Radio Button: Standard Sound Standard Sound Alert: others.wav [OK] button... [New] button... Var Name: OpenBuy Name: Open Buy Description: In Auto-Trade Mode, it requests a BUY market order to open a BUY trade * Checkmark: Trading Enabled Select Trading Bookmark Trading Action: BUY Trader’s Range: 10 [OK] button... [New] button... Var Name: CloseBuy Name: Close Buy Description: In Auto-Trade Mode, it requests a SELL market order to close a BUY trade * Checkmark: Trading Enabled Select Trading Bookmark Trading Action: SELL Trader’s Range: 10 [OK] button... [New] button... Var Name: OpenSell Name: Open Sell Description: In Auto-Trade Mode, it requests a SELL market order to open a SELL trade * Checkmark: Trading Enabled Select Trading Bookmark Trading Action: SELL Trader’s Range: 10 [OK] button... [New] button... Var Name: CloseSell Name: Close Sell Description: In Auto-Trade Mode, it requests a BUY market order to close a SELL trade * Checkmark: Trading Enabled Select Trading Bookmark Trading Action: BUY Trader’s Range: 10 [OK] button... - In the Formula Bookmark, copy and paste the following formula:
//Provided By: Visual Trading Systems, LLC & Capital Market Services, LLC //Copyright (c): 2009 //Notes: March 2009 T.A.S.C. magazine //Notes: “Monte Carlo Conniptions: Trade System Evaluation” by Donald W. Pendergast, Jr.} //Description: Reversed MACD Crossover System //File: tasc_RevMACD.vttrs {Error Control} Error_MacdShMaPeriods:= Error(perShort=0,’Input Error: “MACD Short MA Periods” cannot equal zero!’); Error_MacdLgMaPeriods:= Error(perLong=0,’Input Error: “MACD Long MA Periods” cannot equal zero!’); Error_MacdMaComparison:= Error(perShort>=perLong,’InputError: “MACD Short MA Periods” cannot be greater than or equal to “MACD Long MA Periods”!’); Error_MacdSignalMaPeriods:= Error(Sig=0,’Input Error: “MACD Signal MA Periods” cannot equal zero!’); {MACD} Fast:= Mov(Pr,perShort,maTp) - Mov(Pr,perLong,maTp); Signal:= Mov(Fast,Sig,TpS); OsMA:= Fast-Signal; {Signal Long and Short} LongSignal:= Cross(Signal,Fast); ShortSignal:= Cross(Fast,Signal); {Auto-Trading Functionality; Used in Auto-Trade Mode Only} OpenBuy:= LongSignal AND (EventCount(‘OpenBuy’) = EventCount(‘CloseBuy’)); CloseBuy:= ShortSignal AND (EventCount(‘OpenBuy’) > EventCount(‘CloseBuy’)); OpenSell:= ShortSignal AND (EventCount(‘OpenSell’) = EventCount(‘CloseSell’)); CloseSell:= LongSignal AND (EventCount(‘OpenSell’) > EventCount(‘CloseSell’)); - Click the “Save” icon to finish building the reversed Macd crossover trading system.
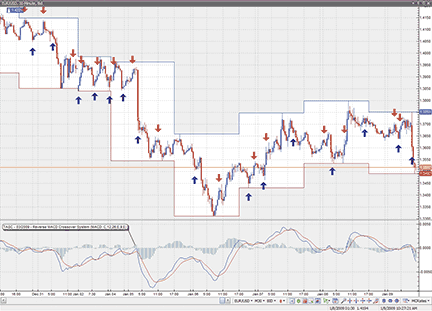
FIGURE 14: VT TRADER, Reversed MACD crossover System. Here is the reversed MACD crossover system attached to a EUR/USD 30-minute candlestick chart.
To attach the trading system to a chart, select the “Add Trading System” option from the chart’s contextual menu, select “TASC - 03/2009 – Reversed Macd crossover system” from the trading systems list, and click the [Add] button. See Figure 14 for a sample chart.
To learn more about VT Trader, visit www.cmsfx.com.
Forex trading involves a substantial risk of loss and may not be suitable for all investors.
BACK TO LIST
TRADE-IDEAS: REVERSED MACD CROSSOVER SYSTEM
“I measure what’s going on, and I adopt to it. I try to get my ego out of the way. The market is smarter than I am so I bend.“ —Martin Zweig
For this month’s Traders’ Tip, we offer an alternative to Donald Pendergast’s use of Monte Carlo analysis on a simple Macd crossover system. While we agree that backtesting is a practical way to obtain trading system test results, we differ on the point of whether that requires thousands of different iterations across years and years of data. The most credible backtesting methodologies weigh the most recent results more so than those in the past. In the real trading world, as a trader, I want to know what’s working now — not what worked well in ’00, ’06, or even most of ’08. Fortunately, we present our backtesting tool, The OddsMaker, and show how (given a strategy or system) your set of trading plan rules can generate high probabilities for winning trades in any market — in this case, with Pendergast’s Macd pattern.
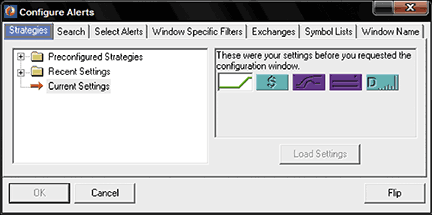
FIGURE 15: TRADE-IDEAS, MACD crossover System. Here is the combination of alerts and filters used to create the “long MACD running up” strategy.
This strategy is based on the Trade-Ideas inventory of alerts and filters found in Trade-Ideas Pro. The trading rules are modeled and backtested in its add-on tool, The OddsMaker.
Here is the strategy based on finding over-extended moves in price:
Like Pendergast’s system, we look for stocks within the Nasdaq 100 (which we create as a separate symbol list within Trade-Ideas Pro) exhibiting daily-based momentum as triggered by an Macd. In Trade-Ideas we call this signal the “Running up or down confirmed” alert. We also do not use a stop-loss for this system. Unlike Pendergast’s system, we apply a slightly different set of trading rules to accommodate our and The OddsMaker’s preference for results based on recentness. We enter at the time of the signal (versus waiting until the next day’s open after the buy signal) and hold the trade until the open three days or until we receive a sell signal (versus waiting until the next day’s open after the sell signal). The results speak for themselves for the three weeks ending 1/6/2009 (though they will test a trader’s risk appetite): a 53% success rate where average winners are almost twice as large as average losers.
Provided by:
Trade Ideas (copyright © Trade Ideas LLC 2009). All rights reserved.
For educational purposes only. Remember these are sketches meant to
give an idea how to model a trading plan. Trade-Ideas.com and all
individuals affiliated with this site assume no responsibilities
for trading and investment results.

Description:  “LONG MACD Running Up”
Type the following string directly into Trade-Ideas Pro using the “Collaborate” feature (right-click in any strategy window) (if typing, spaces represent an underscore):
https://www.trade-ideas.com/View.php?O=100000_1_0&QRUC=5&MaxDNbbo=0.1&MaxSpread=15&MinPrice=
5&MinVol=300000&WN=LONG+MACD+Running+Up+HOLD+3d+Open+-+EXIT+RDC+%285%29+-+No+Trades+60m+B4
+Close+-+No+SL&SL=8
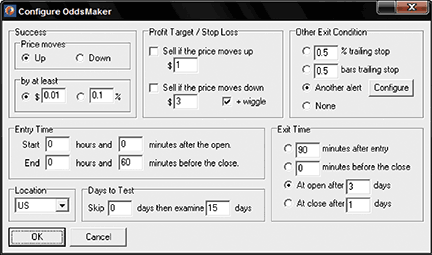
FIGURE 16: TRADE-IDEAS, ODDSMAKER MODULE. This shows the OddsMaker backtesting configuration for the Trade-Ideas “long MACD running up” strategy.
This strategy also appears on the Trade-Ideas blog at https://marketmovers.blogspot.com/ or you can build the strategy from Figure 16. That screen capture shows the configuration of this strategy, where one alert and four filters are used with the following specific settings:
- Running Up (confirmed); with a ratio value of 5
- Min Price Filter = 5 ($)
- Max Spread = 15 (pennies)
- Min Distance from Inside Market Filter = 0.1 (%)
- Min Daily Volume Filter = 300,000 (shares/day)
The definitions of these indicators appear here: https://www.trade-ideas.com/Help.html.
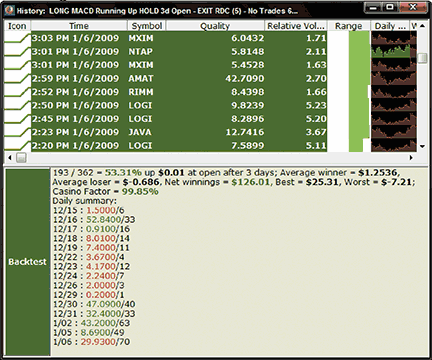
FIGURE 17: TRADE-IDEAS, MACD crossover System. Here are the OddsMaker results for the “long MACD running up” strategy.
Trading rules
That’s the strategy, but what about the trading rules? How should the opportunities the strategy finds be traded? Here is what The OddsMaker tested for the past three weeks ending 1/6/2009 given the following trade rules:
- On each alert, buy the symbol: go long (price moves up to be a successful trade)
- Schedule an exit for the stocks at the open after three days
- Exit the position if the same symbol triggers a “running down (confirmed)” alert set at the same ratio of 5
- Start trading from the open
- Stop new trades 60 minutes before the end of each day’s close.
The OddsMaker summary provides the evidence of how well this strategy and our trading rules did. The settings are shown in Figure 16.
The results (last backtested for the three-week period ended 1/6/2009) are shown in Figure 17. You can better understand these backtest results from The OddsMaker by consulting the user’s manual at https://www.trade-ideas.com/OddsMaker/Help.html.
BACK TO LIST
METASTOCK: REVERSED MACD CROSSOVER SYSTEM
The MetaStock code for the reversed Macd crossover system from “Trade System Evaluation” by Donald Pendergast in this issue is below.
MACD REVERSED CROSSOVER SYSTEM CODE
For MetaStock Exploration
Long entry:
Cross(Mov(MACD( ),9,E),MACD( ))

Short entry:
Cross(MACD( ),Mov(MACD( ),9,E))

For MetaStock TradeSim Enterprise Exploration:
EntryTrigger := Ref(Cross(Mov(MACD( ),9,E),MACD( )),-1);
EntryPrice := OPEN;
ExitTrigger := Ref(Cross(MACD( ),Mov(MACD( ),9,E)),-1);
ExitPrice := OPEN;
InitialStop := 0; { no initial stop used }

ExtFml( “TradeSim.Initialize”);
ExtFml( “TradeSim.RecordTrades”,
        “MACD Crossover Reversed”,      { Trade Data Filename }
         LONG,                {Trade Position Type}
         EntryTrigger,        {Entry Trigger}
         EntryPrice,           { Entry Price }
         InitialStop,            {Optional Initial Stop}
         ExitTrigger,           {Exit Trigger}
         ExitPrice,              {Exit Price}
         START);              {Recorder Control}
BACK TO LIST