Volatility
A Peek Into The Mind Of Traders
Volatility Is Dominant Theme In Stocks
The market may be setting up for a period of consolidation.
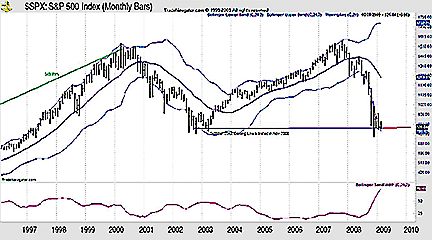
From a technical perspective, the biggest factor in the markets is volatility (Figure 1). Since the large down move in autumn 2008, price action has settled into a consolidation pattern. While some technical indicators show signs of strength, others indicate further weakness. Bollinger bands, the technical trading tool developed by John Bollinger in the early 1980s, quantifies the observation that volatility is dynamic, described by Bollinger as meaning that periods of low volatility are inevitably followed by periods of high volatility and vice versa.
Bollinger bands consist of a set of three lines drawn relative to price. The middle band is a measure of the intermediate-term price trend, a simple moving average. The upper band can be found by adding two standard deviations of that average to the average; subtracting two standard deviations from the average yields the lower band. While the math is complex, the important point to remember is that wide bands indicate wild markets and are usually followed by narrow bands and calm markets.

FIGURE 1: S&P 500, MONTHLY. Volatility is returning to lower levels.