Trading Systems
A Look At Correlated Funds
Profit With High Relative Strength Mutual Funds
This timing method will maximize profit and reduce drawdown.
Correlation of equity funds phenomena manifests itself in many stock data series. For this study, I explored the correlation of two mutual funds and methods of timing one fund to maximize profit and reduce drawdown. Backtesting a specific model indicates that a 10.82% return and a maximum drawdown of about 11% over the last six years is possible. Before looking at the model, a brief review of funds shows the qualitative nature of correlation and a visual depiction of the timing method.
Mutual fund selection
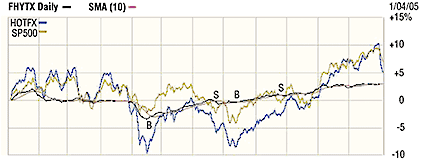
Two mutual funds are considered correlated if they generally rise and fall during the same period. I studied the use of the Federated High Yield fund (Fhytx) and the FundX Aggressive Upgrader fund (Hotfx). Looking at Figure 1, you can see that Fhytx and Hotfx are correlated.

Figure 1: correlation of mutual funds. Here are two funds, HOTFX and FHYTX, and the S&P 500 with a 10-day moving average of FHYTX overlaid. Note that the two funds are highly correlated.
The high-yield fund frequently moves later, compared to the equity fund during price upturns, and trends downward earlier than the equity fund. The statistical measure — beta — shows a correlation of only 0.865 with the Standard & Poor’s 500, so it is possible that the correlation of high-yield bonds versus equities is not exact. I use five- and 10-year average beta values and believe this is a good proxy for most equity trends.
Look at Figure 1 and imagine trading Hotfx during periods when high-yield bonds are trending up in price. I add a 10-day simple moving average to Fhytx to serve as a signal line so that a rise above the line indicates a buy and prices below the line serve as a sell signal. A select period shows the example with B (buy) and S (sell) labels at obvious crossovers. The entire period of six years is not present due to space constraints. Visual inspection indicates that a profit is possible.