NEW TECHNIQUES
Value At Risk And True Range
True Range, Reward/Risk, And Position Size
This method uses the concept of value at risk and true range to determine a reward to risk ratio and position size for trading stocks. The process has been reduced to two Excel spreadsheets for ease of calculation.
Reward/risk ratio and position size are two variables you need to know before you initiate a trade. Value at risk (Var) will help you calculate these two variables. The Var of an equity position is the amount of money that you can expect to lose during a fixed period within a certain probability. Using the usual measure of mean and standard deviation of percentage price changes as a measure of risk, you can measure the underlying stock risk to determine if it falls within acceptable limits based on your account size and the amount you are willing to lose on the trade.
Position size tells you how many units, or shares, you are going to put on, given the size of your account. Position-sizing is the essence of money management. Too few shares or units and your return will be inadequate. Too many and your risk will be too high.
By using a security’s volatility or true range (TR) to evaluate Var, you can determine the appropriate position size based on your risk tolerance and the typical price movement of the security over a specific period of time.
The customary calculation of Var depends on the volatility of closing prices only. However, this Var calculation has some assumptions that will not hold in normal market conditions. First, closing prices are used but most traders don’t usually buy or sell at the end of the day. Second, it is assumed that real data has a normal distribution without fat tails or skewed patterns. As we all know, normally distributed data is the exception, not the rule. In addition, note that you can place an order to buy or sell at the close.

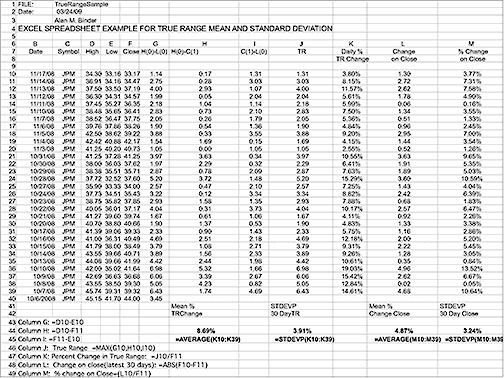
Figure 1: True Range Sample. In this Excel spreadsheet you see the calculations for the mean (average) TR percent change and standard deviation of TR percent change.
A much closer approximation of Var should use the real variation of price (TR), not just the end of day or closing price. Here, I substitute TR for the change in closing prices. The TR for each day is the maximum excursion of price from the close of one day to the close of the next day: the maximum of high (today) - low (today) or high (today) - close (yesterday) or close (yesterday) - low (today). Implementing this in an Excel spreadsheet simplifies the method and minimizes subjectivity. See Figure 1, “True range sample.”