Letters To The Editor
May 2009 Letters To The Editor
The editors of S&C invite readers to submit their opinions and information on subjects relating to technical analysis and this magazine. This column is our means of communication with our readers. Is there something you would like to know more (or less) about? Tell us about it. Without a source of new ideas and subjects coming from our readers, this magazine would not exist.
Address your correspondence to: Editor, Stocks & Commodities, 4757 California Ave. SW, Seattle, WA 98116-4499, or E-mail to editor@traders.com. All letters become the property of Technical Analysis, Inc. Letter-writers must include their full name and address for verification. Letters may be edited for length or clarity. The opinions expressed in this column do not necessarily represent those of the magazine. —Editor
Clarification On Double 7s Strategy
 Editor,
In the January 2009 S&C article, “Three Rules, One Easy Way To Trade Etfs,” Figure 2 shows point B and the caption refers to “a new, seven-day low at point B.” However, two days earlier, the price bar is lower than the bar pointed to at B (using a magnifying glass).
A check of my data shows the same results. Point B, on December 14, 2007, has a low of 50.92, but on December 12, the low is at 50.89, according to data from Yahoo! Finance. Is it possible the arrow is pointing to the next day, or do the authors mean a “new, lower close?”
—Tom Bulkowski
Yes, in this case, authors Larry Connors and David Penn mean a new, lower close, even though the intraday low may have been lower two days ago. This is based on the second rule, which states that if the Etf closes at a seven-day low, you would buy on the close.
—Editor
More On Double 7s
Editor,
I have a question for Kirk Dolan, who had a letter to the editor in the March 2009 S&C. The question is in reference to one of the rules for Larry Connors’ Double 7s strategy, which was described by Larry Connors and David Penn in their January 2009 S&C article, “Three Rules, One Easy Way To Trade Etfs.”
In Dolan’s letter, in rule 3, he states: “After the seven-day high (day 1), if the next three days’ highs finish above day 1’s close…”
Is Dolan talking about the intraday high of the bar being above day 1’s close, or the close of the bar being above day 1’s close? I am thinking he is referencing the close, not an intraday high.
I use TradeStation, so I am trying to code this. Thanks for the clarification.
—Paul Hnidka
Kirk Dolan replies:
Thanks for your question. I used the highs above day 1’s close, but you are correct that using the closes above day 1’s close gives better results: fewer run-ups, but more points gained; a higher percentage of successful trades; and a higher average annual return (see Figure 1 and compare tests 1 and 2).
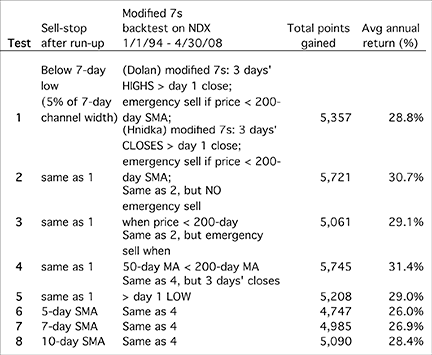
Figure 1: SAMPLE RESULTS FROM KIRK DOLAN FOR MODIFIED Double 7s STRATEGY
In addition, I didn’t mention that I had an automatic emergency sell when the Ndx price drops below the 200-day Sma when a buy was on. I inferred that Connors did that, but he did not specify it in his article. Later, I found that the key sell signal for Ndx is not when the price drops below the 200-day MA (case 1), but when the 50-day Sma (simple moving average) crosses below the 200-day MA (case 2). The reason is that the serious long-term drops — where a seven-day high is not hit for weeks or months — occur only in case 2 (maximum loss on one trade = -16%). In case 1, the price will eventually pop up to a seven-day high, preventing large losses (maximum loss = -9%). Test 3 shows that having no emergency sell at all increased the percentage of successful trades, but decreased total profit. Test 4 shows that having the 50/200 emergency sell increases the percentage of successful trades and profit.
Two other conditions I checked were:
- Each of the three days’ closes is above the low of day 1 (this is a less-strict condition; see test 5); and
- Once the runup has begun, optimize the looser sell condition using different MAs (moving averages), such as the five-day, seven-day, and 10-day MA (tests 6–8).
Test 5 gave the most runups (more than half the trades) and a high percentage of success (81.1%), but total profit was not noticeably increased. I noticed that different Etfs will have clearly different optimums. For example, Skf is much more volatile and may have an optimum sell at the five-day MA. Therefore, I doubt there is a universal “optimum” sell-stop MA for all Etfs. Whenever you buy a stock or Etf, I assume you can immediately determine the optimum “run-up sell stop” by backtesting it in TradeStation.
It’s not practical for me using Matlab to test a large database of Etfs simultaneously like TradeStation users can do. I can easily check one Etf at a time, though. Maybe you can come up with better results because you have access to the database.
Summary for Ndx: The highest percentage of successful trades occurred using modified 7s where (test 7):
- After a seven-day high, all next three days’ closes > day 1 close (your recommendation);
- Emergency sell when 50-day MA < 200-day MA if it occurs when buy is on;
- During run-ups, sell occurred at the seven-day MA.
Also, time in the market was only 47.8%.
Loosening the runup criterion to test 5 (that is, three days’ closes above day 1 low rather than day 1 close) will also work well.
I haven’t had time to test this against other Etfs. Please let me know if you have other questions. I’d be delighted to see if you have other helpful results using TradeStation.
And More On Double 7s
Editor,
I appreciated the letter from Kirk Dolan in the March 2009 Letters To S&C regarding Larry Connors’ Double 7s strategy. In his letter, he mentions: “1. Set a buy-stop 0.1 above the close of the seven-day…” I’m hopeful that Dolan will elaborate on what he means by 0.1. If buying Gld, for example, does the 0.1 translate to 10 cents?
—MJ, Chapel Hill, NC
Kirk Dolan replies:
Yes, 0.10 refers to 10 cents for the tests I did on Ndx. I hope to run some more tests on Gld and will report back.
Heikin-ashi Based Oscillator
 Editor,
I read with interest the letter in the February 2009 S&C titled “Heikin-Ashi–Based Oscillator” along with Sylvain Vervoort’s reply. The results of the system tester are impressive. Writing the strategy for Explorer and then running the exploration gives you a number of stocks that give buy signals. What strategy/formula would Vervoort use in the exploration to identify those stocks that are sure to give the best performance? In other words, how would he filter the list down to two or three stocks that would perform well?
—Jacob Singer
Sylvain Vervoort replies:
Personally, I do not follow a large number of stocks. For trading based on daily prices, I limit the number of stocks to about 25. I have no formula to select these 25 stocks. What I do is visually inspect the long-term behavior of all the stocks in my database and make a selection based on criteria as follows: I look for stocks that have a history of bigger price moves over longer periods of time, avoiding stocks with a history of:
- Little price change over longer periods of time
- Very high intraday volatility
- Very high daily volatility
- Regular big surprise moves.
Another very important point is money management. The money management method I use on the limited selection of stocks is an equal distribution of the available capital between these stocks. Each stock will be traded individually with no profit or loss sharing with the other stocks in the portfolio. This is one of the most important reasons to work with a limited selection of stocks.
It is then possible to keep individual charts per stock to maintain comments, trendlines, and so on, on each chart.
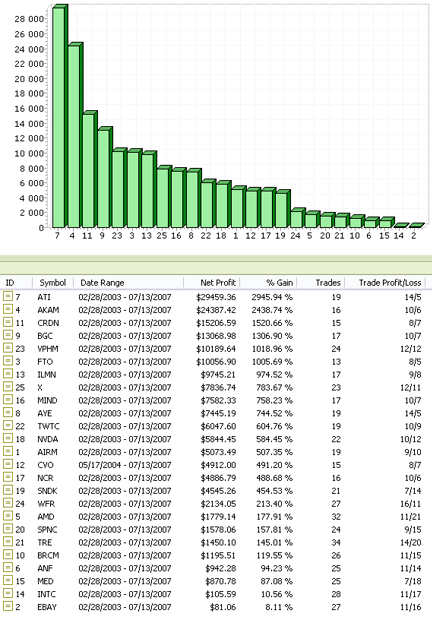
Figure 2: SAMPLE RESULTS FROM SYLVAIN VERVOORT FOR HeikIn-Ashi Based Oscillator
As I write this, I am using the following set of stocks: Airm, Akam, Amd, Anf, Ati, Aye, Bgc, Brcm, Crdn, Cvo, Ebay, Fto, Ilmn, Intc, Med, Mind, Ncr, Nvda, Sndk, Spnc, Tre, Twtc, Vphm, Wfr, X.
Running a backtest with these stocks in an uptrending market using closing prices, between 2/28/2003 through 7/23/2007, using the original formula as proposed by the unnamed letter-writer in the February 2009 S&C, and with the settings of a five-day summing period and reversing at a value of -20 (per the formula given in the February 2009 issue of S&C), I then get the following results with these settings:
- Each stock has $1,000 to start with and there is no profit or loss sharing with the other stocks and we are going long only, inclusive of brokerage costs, the total profit is 365% with an average of 54 trades per stock.
Running the same test again, but now from the period 2/28/2003 to 3/5/2009, including the very big correction we are having now, the profit drops to 87% with an average of 78 trades per stock.
If you want fewer trades, one of the things that can be done is to rework the formula. I tried it with this version:
	period:=9;
	haclose:=(O+H+L+C)/4;
	haopen:=(PREV+Ref(haclose,-1))/2;
	hahigh:=Max(Max(H,haopen),haclose);
	halow:=Min(Min(L,haopen),haclose);
	haC:=(haClose+haOpen+haHigh+haLow)/4;
	counter:=If(halow>Ref(halow,-1) OR haC>= Ref(haC,-1),1,
             If(hahigh<Ref(hahigh,-1),-1,0));
	indic:=Sum(counter,period)/period*100;
	buy:=indic>-20;
	buying:=If(buy=0 AND Ref(buy,-1)=0,0,1);
	buying
With this change, running the test from 2/28/2003 until 7/23/2007 gives a profit of 705% with an average of 21 trades per stock (Figure 2). Running the same test from 2/28/2003 until 3/5/2009 still gives a profit of 190% with an average of 34 trades per stock. Thus, this version will probably be more suitable if you want fewer trade signals.
The nicest picture is, of course, the result you get during the uptrending market, confirming that it is always a good idea to trade with the market trend.
Macd Parallax View
Editor,
I was interested in Edward Donie’s article “An Macd Parallax View” in the 2009 Bonus Issue of S&C.
It is generally thought that using Macd on a fund with some degree of upward trend would yield a positive result. In my January 2005 S&C article, “A One-Rank Screening Technique for Mutual Funds,” I showed that over the 10 years I studied (Figures 3 and 4) that 31 of the 32 funds studied using Macd, a positive return was achieved, averaging 2% to 7% better annualized return than just holding. I also found that if the fund had low persistence (as measured and explained in that article), the Macd return would approach zero. This brings up my first question: Why does the author believe that a negative return was achieved in his Macd study of the Russell 2000 as opposed to what one would have expected (at least a modest return)?
In his Figure 4, he states that the average 20-day price change is 1.9%. Does that imply a 26.8% compound annualized return over 252 market days? It appears not, as I looked up the Rut index and got about 9.2% annualized return over the author’s time period stated, which calculates to a 0.7% return over an average 20-day period, and that is far less than the 1.9% referenced. Why the difference?
I found Figure 6 surprising. I would have thought that the distribution would be quasi-random (more bell-shaped) rather than the dearth of values around the central peak.
I believe when one sells using Macd, you are out of the market (I have found about 50% of the time for typical Ema values of Macd), although the author makes no mention of that fact. Being out of the market is considered a good thing as it tends to break up drawdowns.
Because the author’s results are counterintuitive, is it possible that the Rut price changes are anti-persistent (switching rate greater than 63 per year as discussed in my article), causing such an anomalous effect?
—Norman Brown
Edward Donie replies:
I don’t have a copy of that issue, but I would enjoy comparing our results. The statistics are based on individual stocks and not funds. In other studies, I have seen that bundles of stocks behave more consistently with technical indicators than do individual stocks. I did this from the perspective of the trader evaluating individual stocks on a day-to-day basis. The statistics are based on a daily evaluation of Macd, which could support your observation that the frequency of evaluation is important to success. In my own investing, I evaluate my own analysis less frequently because the day-to-day volatility is troublesome in assessing opportunities.
Follow-Up
Mr. Donie,
I’m uncertain what your data summarizes. Do you use Macd on a Rut stock, then after selling, perhaps buy another Macd stock, and so on? What do you mean by the 1.9% average 20-day price change — is that for a composite of stocks? Does my 26.8% annualized calculation apply? It seems high for sequence of Rut stocks of over 20 years’ duration unless it is cherry-picked in some manner.
I did enjoy your article and I compliment you on your professional-looking graphs and for presenting such a complex approach (looking at 1,500 stocks).
—Norman Brown
Edward Donie replies:
The overall gains in the study are higher because of survivor bias. Figure 3 in my March 2009 article portrays this in that the earlier years have fewer trading days because I used 1,500 stocks that were in the Russell 2000 recently. Any stocks in the earlier years that dropped out of the index would not be included. I also left out stocks that had fewer than a thousand days, which eliminates more recent additions.
The approach is not a backtest of trading rules. All stocks in the sample have their percentage Macd calculated for every day there was data. For each day, the percentage change in price over the next 20 days was calculated. The primary question was: If I look at Macd on a daily basis, what would be the expected change over the next 20 days? Figure 7 in the article portrays those average changes depending on the value of Macd as a percentage of the current price. Figure 8 uses the standard deviation of gains for a gauge of how wide the distribution is so that you can judge the risk of achieving the average gain. The commonly used signal of moving from minus to positive seems unsupported.
In comparing methods of forecasting future prices, I got the strongest results by simply using today’s price. That is why you see such a strong showing at no change. I have seen many studies, and so far, my own work confirms that distributions of gains and losses are long-tailed rather than normal as in the bell curve.
I hope this helps to explain my thinking in this study. I believe, as you may, that to be successful, one must always be a student of market behavior.
Thank you for your interest.