CHARTING
How Are You Trading?
Going Long Vs. Going Short
There’s a world of difference between uptrends and downtrends. Here’s a look at different setups and how you can use them to succeed in long and short positions.
When I first began selling short a few years back, I didn’t do very well. I was stopped out of trade after trade, and I kept missing out on the best opportunities. At first I didn’t understand what was wrong: I was using the exact same methods that I had used successfully to go long, and simply reversed the rules and setups. Why wasn’t it working?
At some point I realized this was a mistake. Why? Because if you examine the charts of uptrends and downtrends carefully, you will see a world of differences between them. Understanding these differences is crucial to successful short-selling.
I would like to demonstrate a few of the differences between common chart patterns in uptrends and downtrends. I will show how they affect my entry setups, stop placement, and profit-taking when going short, compared to going long.
#1: Downtrend pullbacks are deeper
In an uptrend, pullbacks are usually weak and shallow compared to the rallies. Pullbacks in downtrends, on the other hand, tend to be much stronger and deeper.
So if we try using the same entry rules for going short on pullbacks, we are likely to miss out on the best trades. We need two different sets of entry rules: one for buying pullbacks in an uptrend, and one for shorting pullbacks in a downtrend. The “buying rules” should avoid strong pullbacks, while the “shorting rules” should allow them.
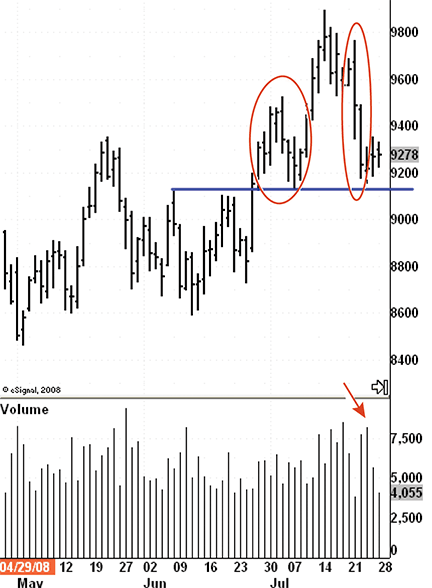
To demonstrate this point, let’s look at a few examples of pullbacks in both uptrends and downtrends. Figure 1 shows two pullbacks in an uptrend in gold futures. In the first pullback, we can see that volume is low, and daily ranges become narrow, especially near the end of the pullback. This means that selling pressure is weak. The downward progress is slow and uneven; most days close well off the low price of the day, and the entire pullback retraces only half of the previous rally.

Figure 1: PULLBACKS IN GOLD FUTURES. Here you see two pullbacks in an uptrend. In the first, pullback volume is a normal correction, with low volume and relatively narrow daily ranges. The second pullback is much deeper: daily bars are wide and volume is high, suggesting that there is a high supply of gold. Such a pullback is a sign of a potential trend reversal.
The second pullback, however, is much deeper than the first, giving back all of the gains made in the previous rally. Volume is high and daily bars are wide, closing near the low of the day. This suggests that a notable supply of gold is being offered. Such a strong pullback in an uptrend is a warning sign. In the case of gold, this strong pullback marked the beginning of a major decline in gold prices to below $700.