FOREX FOCUS
In Search Of Signals (If There Are Any)
The Trend Is Your Friend
In this, the first part of a price model series, we look at trends.
The fundamentals of technical analysis have been discussed to great lengths in the past. This includes topics such as support, resistance, trendlines, and channel lines. Now we can move one step forward and begin to study the graphic models of these different types of charting tools.
One of the tenets of technical analysis is that price movement is subject to trends. One glance at a price graph will reveal its distinguishing feature: Price is always moving. This movement gives you the opportunity to make money. The old saying “the trend is your friend” is important for every trader.
Analysts have noticed one more specific feature of price movement: A trend reversal does not occur instantaneously with a wave of a wand. In most cases, a trend slows down and stops before reversing. A pause occurs in the movement — a transition period — after which the trend continues or reverses. During transition periods, various price configurations occur, which allow you to predict further price movement. I refer to these price formations that regularly emerge in price charts as models.
These price formations reflect the mass psychology of market participants. Since they are based on human psychology, which does not change over the years, the formations may be divided into certain groups and used to predict further dynamics of the market. In this first part of a series of five articles, I will go over some of the general characteristics of price formations.

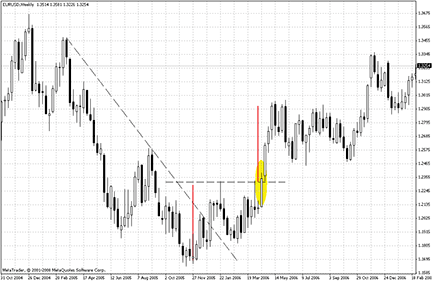
Figure 1: eur/usd weekly chart. Here you see the behavior of a trend, with prices breaking through the trendline, reversals, and possible false breakthroughs.