TRADING TECHNIQUES
What’s That I See Ahead?
Identifying Market Reversals
Here’s a specific technique warning about coming reversals and the steps to apply the methodology.
Back in the November 2008 issue of Stocks & Commodities, I pointed out how you could reduce risk and increase trading returns by trading as close as possible to market reversals or, as I call them, pivot points. I also hinted that by using the %R oscillator and the price position in a channel, you could anticipate the reversal and be prepared to trade it. In this article I will provide a specific technique for warning about coming reversals and detail the steps to apply the methodology.
About oscillators
Oscillators use some algorithm of price to measure overbought and oversold conditions of a market based on a certain lookback period. The oscillator is coded to range between a designated upper and lower value. The overbought and oversold conditions occur when the oscillator moves near these extreme values. These are considered warning areas where trend reversals may occur. Actual trading signals are given when the oscillator reverses direction in the overbought/oversold region or exits the region.
One such oscillator, %R, measures the last price as a percent of the range of price over the lookback period. The overbought/oversold areas are usually 80% and 20%, so when price is above 80%, it is considered overbought and when below 20%, it is considered oversold.

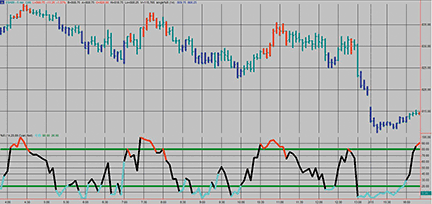
Figure 1: 5-minute chart of S&P emini. Here you see the standard application of the %R with a lookback period of 14. The overbought/oversold areas are usually 80% and 20% so when price is above 80%, it is considered overbought and when below 20% it is considered oversold.
Figure 1 illustrates the standard application of the %R with a lookback period of 14 on a five-minute S&P emini chart with the price being the close of the bar. I have coded a TradeStation Paintbar to show when the overbought and oversold conditions occur on the price chart. Red bars indicate oversold and blue bars indicate overbought. (See sidebar, “Trend Change Warning Paintbar.”)