INDICATORS
Applying Levine’s Topfinder/Bottomfinder
Applying Midas To Daily And Weekly Charts
In this second part of this series we go one step further by adding deeper insight into price action.
So far, we have explored what technical analyst Paul Levine called the scientific aspect of the market interpretation/data analysis system (Midas) — that is, the quantitative laws that give rise to Midas and the curves of Levine’s indicator, the topfinder/bottomfinder (TB-F). In this article, we will examine what Levine called the engineering aspect of Midas — the practical trading rules on which the system is based.
This first section on the application of TB-F to daily and weekly charts is largely the contribution of David Hawkins. Hawkins will expound on the rules governing the application of TB-F as recommended by Levine using StockShare (v2). As a result of Hawkins’s input, this program now has Midas and TB-F plugins for its end-of-day platform.
Like the original WinMidas, Midas curves and the D component of the TB-F algorithm are calculated automatically in StockShare by the user selecting the curves and dragging them with a mouse.
It should be emphasized too that David Hawkins is more conservative than Andrew Coles in demanding the completion of half of an accelerated move before attempting to fit a TB-F curve. This is reflected in the TB-F plugin in StockShare (v2). No such limitation exists in the eSignal version.

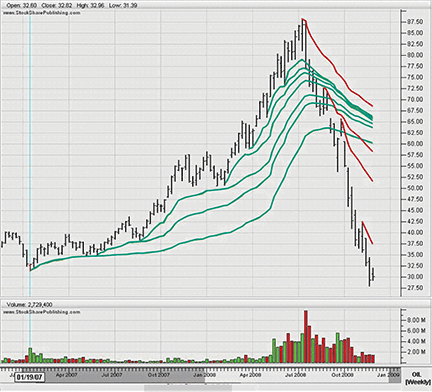
Figure 1: weekly chart of oil, the ipath s&P crude oil total return. With time along the x-axis, MIDAS (and TB-F) curves appear less smooth than their counterparts in Equivolume charts.
Prelude: Equivolume
First of all, let us introduce (or reintroduce) you to the Equivolume style of technical charting devised by Richard Arms Jr. This charting form combines price and volume in one chart pane so that times of heavy trading volume are emphasized while light volume periods are deemphasized. Hawkins uses this chart style because the x-axis is proportional to cumulative volume and not time; as a result, Midas and TB-F curves will often plot more smoothly. In addition, Equivolume charting allows full use of Arms’s other volume analysis techniques, which are supportive of the Midas framework. (See sidebar “Equivolume Charting” on page 56.)
It is entirely up to you whether you’ll use slightly smoother curves like this, or prefer traditional candlestick charting the way Coles does, because of the alternative benefits this brings at the expense of smoother curves.