CHARTING
Volume And Forex, Together
Pump Up The Volume
Here’s how you can use Wyckoff volume analysis to trade the forex markets.
It is a nearly universal belief among forex traders that volume analysis techniques cannot be utilized in their market analysis. This belief exists because spot forex does not trade on a centralized exchange and so no actual traded volume figures are available for traders to analyze. Volume analysis in the forex markets is not only possible to perform, but it in fact provides a great edge that enables the trader to properly read the chart to determine where supply/demand imbalances are occurring in real time.
These areas of imbalance create sizable market moves that the trader can take advantage of by trading in the path of least resistance. For the volume analysis, I will be sharing techniques pioneered by Richard D. Wyckoff more than 100 years ago; these methods have withstood the test of time and are very powerful when used correctly.
Wyckoff volume
First, let’s discuss this issue of receiving volume figures to work with. While it is true that actual traded volume figures are not available to us as traders, we still have a means to achieve the same desired effect. In the place of actual volume, we will instead use tick-based volume. Most traders believe that tick volume has little merit as a replacement for actual traded volume figures.
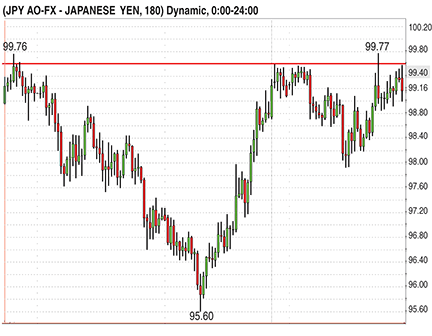
Figure 1: 180-minute chart of usd/jpy. The red line represents a valid resistance line. When price is approaching this area of resistance, you look to see if supply will be dumped on the market from the large professional traders. Conversely, as price approaches a support area, you look to see if demand is coming into the market at those price levels.
The underlying reason this is such a widely held belief is that most traders have never had proper volume analysis training. Without the necessary background to understand volume in all of its available forms, it is easy to hold this mistaken belief.