CHART PATTERNS
Part 2 Of The Price Model Series
Head & Shoulders
Here’s a look at a familiar reversal pattern, the head & shoulders pattern.
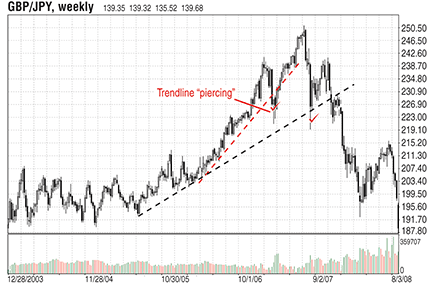
In this installment of the price model series, we will look at a well-known trend reversal model, the head & shoulders pattern. In part 1 last issue, I explained that for a price model to form, a previous trend needs to exist. The condition for the formation of a head & shoulders pattern is an ascending movement on a price chart, when every rise and fall is higher than the previous one. In Figure 1, you can see that at a certain stage in its development, the trend has accelerated. This is shown by the second trendline, which is steeper than the original. But sooner or later all good things end. The preliminary signal of the trend slowing down occurs when price pierces both trendlines.
The breaking of the trendline does not necessarily mean that there will be a reversal in the trend. Instead, consider it a signal to close all long positions you bought at a bargain and not open any new positions. It is like catching a cold but you know you will recover soon.

Figure 1: piercing trendline. At a certain stage in its development, the trend has accelerated. This is shown by the second trendline, which is steeper than the original trendline. The preliminary signal of the trend slowing down occurs when price pierces both the trendlines.
However, you do need to be prepared if the situation gets worse. If the price overcomes the previous high, it means that the trend has recovered and the ascending trend has regained its strength. But if the price moves upward again after the downward correction but its high is lower than the previous high, it is a strong indicator of an oncoming reversal.