AT THE CLOSE
10 Tips For Buying Stocks
Here’s a handy set of tips on what to look for in a stock to add to your portfolio.
Traders and investors are always shopping for bargain stocks. When you log onto your favorite website and see that the price of a stock has dropped 50%, does the half-off sale mean you should buy? Perhaps. This article reviews shopping tips to help improve your chance of picking a winning stock.
Tip #1: Buy in a bear market and hold in a bull market
I computed the year-to-year price change of 565 stocks from 2000 to 2009. The table in Figure 1 shows the results. For example, the change in price from January 3, 2000, to January 2, 2001, was a drop of 1%. The bear market began in March 2000 and ended in October 2002. Look at the recovery in 2004, a year after the bear market ended. Prices climbed by 23%.
I know from research into dead-cat bounces (a chart pattern) that the larger the drop, the greater the bounce. Since the average price of the stocks I follow dropped 62% from 2008 to 2009, I expect a large bounce after the bear market ends. The table suggests that holding a stock at least a year into a bull market following a bear market will lead to tasty gains.

Figure 1: ANNUAL PRICE CHANGES IN BULL AND BEAR MARKETS. The change in price from 1/3/2000 to 1/2/2001 was a drop of 1%. The bear market began in March 2000 and ended in October 2002. Look at the recovery in 2004, a year after the bear market ended. Prices climbed by 23%.
Tip #2: Buy small-cap stocks
Market capitalization is the number of shares outstanding for a stock multiplied by the current price. I consider stocks below $1 billion as small caps and those above $5 billion as large caps. Everything between those two values are midcaps. Those boundaries can vary from service to service, so be sure to check their definitions.
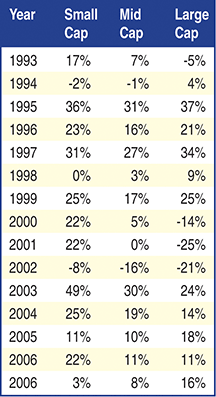
Figure 2 shows the results of annual price changes from the start of 1993 to the end of 2007. For example, small caps showed a gain of 17% from January 1993 to January 1994. Midcaps posted a 7% rise over the same period and large caps showed an average decline of 5%. In this test, I used 911 stocks, but not all stocks had data going back to 1993. In fact, few large-cap stocks appeared in the early years (fewer than 30 samples until 1996).
If you counted the highest number in each row, you would have found that small caps won nine contests, large caps won seven, and midcaps were shut out. I counted a tie as a win.
Look at the recovery after the 2000–02 bear market. Small-cap stocks soared by 49% in 2003. What surprises me is that they held their value so well during the bear market, beating mid- and large caps by a wide margin.

Figure 2: ANNUAL PRICE CHANGES BY MARKET CAP (1993—2007). Small caps showed a gain of 17% from January 1993 to January 1994. Midcaps posted a 7% rise over the same period and large caps showed an average decline of 5%.
Tip #3: Buy low-priced stocks
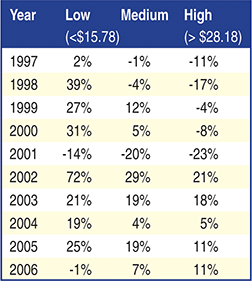
Buy low-priced stocks because they outperform the other prices. You might think that this would be easy to test, but it’s not. You have to examine each stock and remove those years in which the price changed because of a stock split. That’s why the table only goes back to 1997 (Figure 3). Earlier than that only a few samples existed (fewer than 30), so I excluded them from the analysis.
Let me give you an example. Say it is 1997 and you own a stock with a closing price of $30. I consider that a high-priced stock. Suppose that in 2000, the stock split two for one, so the 1997 price dropped to 15. A $15 stock is now considered a low-priced one. Thus, to make the analysis fair in a historical price series for that stock, you have to remove all years from 2000 and before.
After removing the split-adjusted securities, I sorted the 769 stocks by price and divided the spreadsheet into thirds. Low-priced stocks were below $15.78 and high-priced ones were above $28.18. Midpriced ones were everything between those two values.
Figure 3 shows the results by year. In every year except 2006, low-priced stocks outperformed the others. In fact, low-priced stocks beat midpriced ones, and midpriced stocks beat high-priced ones (except in 2006, when the relationship reversed).
Focus on the fundamentals: If I say fundamental analysis, many of you may roll your eyes and shake your heads. But when locating a house, builders choose bedrock instead of quicksand on which to construct the foundation. Selecting stocks based on fundamental analysis can give you a sturdy foundation for your portfolio, too. I will be brief, but you can visit my website for more details about these fundamental factors.

FIGURE 3: ANNUAL PRICE CHANGES BY PRICE. In every year except 2006, low-priced stocks outperformed the others. In fact, low-priced stocks beat midpriced ones, and midpriced stocks beat high-priced ones.
Tip #4: Choose stocks with a low price to book value
Book value is the measure of a company’s net worth after all the bills are paid and all assets are liquidated. If the company were to go out of business, book value approximates what would remain for shareholders. It is not market value, so do not confuse the two.
Stocks with a low price to book value ratio tend to perform better than those with a high price to book value. I used a database built from Value Line data from 1992 to 2006. Comparing the future one- to five-year price returns starting from 1992, I found that stocks with price to book value ratios below the annual median won 78% of the contests.
In a second test, I used almost 1,000 samples and compared the performance of stocks with price to book values above and below the median 2.38. Those above the median value had gains a year later averaging 8.8%. Those below the median had gains averaging 15.7%.
If you can find stocks with book values between zero and 0.5, give them strong consideration. An unpublished study I conducted found the one-year gain averaged 190%, with 148 samples qualifying.
Tip #5: Choose stocks with low price to cash flow ratio
Cash flow is the money a company takes in when running its business, and many consider it an important factor in the health of a company.
In tests similar to those described for book value, I found that stocks with a low price to cash flow ratio outperform those with a high ratio 78% of the time. A low ratio means cash flow is high relative to the stock’s price.
In a second test, I used a median price to cash flow of 10.34. Stocks above the ratio had one-year gains averaging 9.62%, whereas stocks at or below the ratio climbed 14.7%.
Tip #6: Select stocks with low price to earnings
Price to earnings is one of the more popular ratios. The P/E ratio is just the price of the stock divided by the earnings per share.
In the same 1992 to 2006 annual contests as described for book value, I found that stocks with low P/E ratios (below the median for that year) beat the one- to five-year performance of stocks with higher ratios 71% of the time. Since P/E ratios can vary by industry, compare each stock to its industry peers and focus your research on those with the lowest ratios.
Tip #7: Stocks that do not pay dividends outperform
A dividend is a portion of the company’s profits distributed to shareholders. The belief is that a company not paying a dividend can reinvest the money back into the business to generate more profits.
I found that companies paying a dividend saw their price climb an average of 9.8% a year, whereas those that did not pay a dividend showed a gain of 13.2% a year later. I used the years 1992 to 2006 in the study.
Looking into the future from one to five years from 1992 to 2006, I found that companies not paying a dividend outperformed 80% of the time.
Tip #8: Select stocks with a low price to sales ratio
The price to sales ratio was the big new thing when I started looking at stocks 30 years ago. It remains popular. A price to sales ratio below 1.0 suggests a good value.
I calculated the median price to sales ratio for each year from 1992 to 2006 and looked at the future one- to five-year price changes. I found that stocks with low price to sales ratios beat those with high ratios 71% of the time.
In a second test that used almost 1,000 samples from 1992 to 2007, I used the 1.0 price to sales ratio as the dividing line instead of the median. Stocks with price to sales ratios above 1.0 showed gains a year later averaging 10.7%. Those with ratios below 1.0 showed gains averaging 12.1%.
Tip #9: Avoid trading stocks that has had a dead-cat bounce within six months
The common phrase “dead-cat bounce” refers to a stock dropping 15% to 70% or more and then bouncing. Once the bounce peaks, price continues lower, averaging declines of 30% in 49 days, according to one study I completed.
I looked at stocks that had one dead-cat bounce and counted how often another appeared within six months. Of those I studied, 15% had one within three months and 38% had one occur within six months.
Why is that? Often, a stock will perform a dead-cat bounce because of an earnings disappointment. Trying to correct an earnings downtrend is like trying to stop a long train after it has sliced a car in two at a railroad crossing. It can take a long time, and the next one or two quarters are often surprisingly bad too. Thus, avoid stocks that showed a dead-cat bounce within six months.
Tip #10: Expect a reversal after a tall candle
When doing research for my book Encyclopedia Of Candlestick Charts, I made several discoveries, one of which concerns tall candles. A tall candle marked a minor high 67% of the time within one day and called a minor low 72% of the time within a day. If you see an unusually tall candle in a stock you want to buy, consider waiting and see how the price behaves. You may be able to buy in at a lower price in a few days.
To use this finding, look for the following:
- The candle’s high must be above the prior two candle highs or below the prior two candle lows.
- The candle must be at least 146% taller than the average candle height over the prior 22 trading days. In other words, look for an unusually tall candlestick.
Closing position
Consider these 10 tips as factors in building a portfolio that will prosper in both the short and long terms. Even if you decide to swing or position-trade your stock selection, you can know that it represents value, and that will entice other investors or traders to add the same stock to their portfolio, creating buying demand. And buying demand is what pushes price higher in the short term.
Suggested reading
Bulkowski, Thomas N. [2008]. Encyclopedia Of Candlestick Charts, John Wiley & Sons.
_____ [2005]. Encyclopedia Of Chart Patterns, 2d ed., John Wiley & Sons.
_____ [2006]. Getting Started In Chart Patterns, John Wiley & Sons.
Charts by Thomas Bulkowski