INDICATORS
Applying Levine’s Topfinder/Bottomfinder
Midas And Intraday Charts
In this third and final part of this series, we will look at how to apply the TB-F algorithm to intraday charts.
Like Midas, which is an acronym for market interpretation/data analysis system, the principles governing the application of Paul Levine’s topfinder/bottomfinder (TB-F) algorithm to the daily charts also applies to intraday charts. In this article, Andrew Coles will follow David Hawkins’ format of combining Levine’s standard rules for applying the TB-F algorithm alongside his own preferred methods of chart analysis.
As discussed in previous articles about Midas, what makes Levine’s volume weighted average price (Vwap) approach so conducive to intraday charts is the insight that the underlying order of market movement is a fractal hierarchy of support and resistance levels. As Coles noted, Levine did not consider the implication of fractal organization for other chart time frames. But it is central to his application of Midas to the daily charts that Midas curves should be plotted on smaller components of the trend as well as larger ones. This insight is crucial to the second role for the Midas curve as a trend overbought/oversold indicator.
With this in mind, we have developed a version of the TB-F algorithm corresponding to the intraday version of the Midas algorithm that Coles ran on MetaStock Pro in previous articles. Like the intraday version of Midas, the only difference between the daily/weekly version of the TB-F and its intraday counterpart, the TB-Fi algorithm, is the location of the price bar in hours and minutes. Because of the essential role of interpolation in the TB-F algorithm, this intraday version has also been written in C++ by Coles and Hawkins’ colleague Satyajit Roy and is now being run in eSignal and very soon in MetaStock Pro.
In line with his own trading practices, Coles will revert to standard candlestick charting and not rely on the Equivolume format.

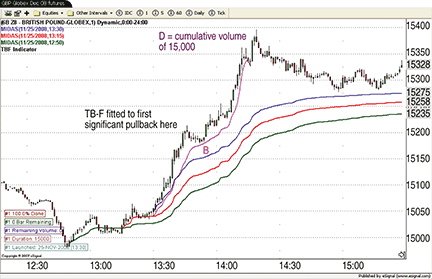
Figure 1: ONE-minute chart of GBP Globex Dec 2008 futures. Only after the third (blue) MIDAS curve displaced from price was the condition satisfied for the launch of a TB-Fi curve. Here, the curve is fitted to the pullback at B with a cumulative volume of 15,000. Two bars after D burned out the trend ended and pulled back to support at the displaced MIDAS curve launched coextensively with TB-Fi.
Engineering TB-F for daytrading
To begin, we’ll confirm that intraday applications of TB-F follow the standard protocols Levine envisioned for daily chart applications. To add variety, Figure 1 is a one-minute chart of the Gbp Globex December 2008 futures. The TB-Fi indicator is the pink curve. Note that three Midas curves were launched before the conditions were suitable for a TB-Fi curve. The first Midas curve (green) was penetrated marginally by the first price pullback, thus ruling out a coextensive launch of a TB-Fi curve at 12:50 pm. Likewise, the second (red) Midas curve also rapidly became a support curve, thus ruling out another coextensive launch at 13:15 pm. Finally, a third (blue) Midas curve was launched at 13:30 pm and price rapidly moved away from it, an indication that a shorter displacement than d was required to “fit” to the price pullback at point B on this chart.