TRADING SYSTEMS
A New Way To Manage Your Position
Surfing Your Position With Wave Stops
When is a good time and place to exit a position?
Whether inspired by Ralph Nelson Elliott’s works or by just a casual observation of a price chart, you can’t help but notice how prices advance, then pause and correct in a wavelike action. What if you could take that basic price movement on the part of buyers and sellers, supply and demand, and use it to manage your position? That is the basic objective of wave stops, the method I developed to determine a good time and place to exit a position.
Wave stops
Wave stops are unusual because the concept does not rely on price or volatility directly. It is a method to set a stop and exit a position based on the profit drawdown of the position. Price and volatility are taken into account, but in an indirect manner. We assume that most moves will come in a three-wave movement — that is, a strong move up, followed by a price correction, followed by the next move up, and so forth. It is not necessary to have three waves; more or less is fine. This process also works with down movements.
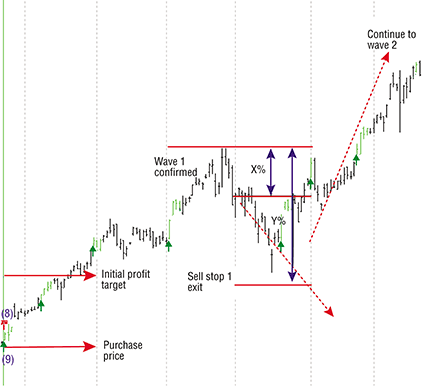
Let’s look at the wave stop rules on a price movement (Figure 1). For this case, let’s use a simple long position. Take a position and set an initial profit target. Once the price gets to or above the initial profit target, apply wave stop rules. The rule states that you must monitor the position’s profit. If it corrects more than a fixed value (x%), that signals that a correction is in process. This is wave 1. Continue to monitor the profit drawdown until a second point is hit (y%). This is your exit or sell-stop level

Figure 1: wave stop rules on price movement. Once price hits the initial profit target, you start to apply the wave stop rules. If price movement corrects more than a fixed value, it signals a correction is in process. You continue monitoring the profit drawdown till a second point is hit. This will be your exit or sell-stop level.
Engineering TB-F for daytrading
To begin, we’ll confirm that intraday applications of TB-F follow the standard protocols Levine envisioned for daily chart applications. To add variety, Figure 1 is a one-minute chart of the Gbp Globex December 2008 futures. The TB-Fi indicator is the pink curve. Note that three Midas curves were launched before the conditions were suitable for a TB-Fi curve. The first Midas curve (green) was penetrated marginally by the first price pullback, thus ruling out a coextensive launch of a TB-Fi curve at 12:50 pm. Likewise, the second (red) Midas curve also rapidly became a support curve, thus ruling out another coextensive launch at 13:15 pm. Finally, a third (blue) Midas curve was launched at 13:30 pm and price rapidly moved away from it, an indication that a shorter displacement than d was required to “fit” to the price pullback at point B on this chart.