Letters To The Editor
September 2009 Letters To The Editor
The editors of S&C invite readers to submit their opinions and information on subjects relating to technical analysis and this magazine. This column is our means of communication with our readers. Is there something you would like to know more (or less) about? Tell us about it. Without a source of new ideas and subjects coming from our readers, this magazine would not exist.
Address your correspondence to: Editor, Stocks & Commodities, 4757 California Ave. SW, Seattle, WA 98116-4499, or E-mail to editor@traders.com. All letters become the property of Technical Analysis, Inc. Letter-writers must include their full name and address for verification. Letters may be edited for length or clarity. The opinions expressed in this column do not necessarily represent those of the magazine. —Editor
TR&NDS TRAILING STOP TECHNIQUE
 Editor,
I have read Sylvain Vervoort’s article on Tr&nds (“Trailing Resistance &nd Support Stops”) in the July 2009 Stocks & Commodities and found it very helpful.
—John C.
KEEPING IT STREAMLINED
Editor,
Thank you to Sylvain Vervoort for sharing his work in your magazine. I am interested in buying his book when it is available.
I started with technical analysis as a broker in 2001. Over the years I started my own investment firm and have been using AmiBroker. (Amibroker provides programming in your Traders’ Tips section.) I’ve gotten very adept at technical analysis but sometimes feel a lack of efficiency. I think this comes from having so much information and knowledge that it becomes difficult to know what information to use. I like Vervoort’s approach because he boils it down to things that work and doesn’t pay attention to the rest.
I’ve studied cycle analysis in depth. I ordered a copy of the seminar that J.M. Hurst put together in the early 1970s and studied it thoroughly. Also love the work that John Ehlers has done in that vein.
Very much looking forward to knowing more about Vervoort’s systems.
—John N.
AVERAGE TRUE RANGE TRAILING STOPS
 Editor,
Thank you for Sylvain Vervoort’s excellent article on the modified Atr (average true range) in the June 2009 S&C, “Average True Range Trailing Stops.”
I have been using it and like it a lot. I have a simple question. What is a better approach: selling the day after the price has gone below the trailing stop, or selling anytime intraday when the price goes below the trailing stop?
—SA
Sylvain Vervoort replies:
Actually, the breaking of this stop in the formula is based on a break by the closing price. So if possible, you should wait to look at price just minutes before the closing and make a decision then. You should not trade with it intraday, because the closing price is not yet known.
The other best solution is to trade the next day at the opening price. Tests have shown that, on average, using a number of different stocks during a longer time period does not show much difference in the results when trading the day after at the opening price.
LOCKIT METHOD
Editor,
I was wondering whether the Sats2 MetaStock Expert discussed by Sylvain Vervoort is available. Will Vervoort’s new book (which I am looking forward to reading) include the MetaStock formulas and examples of the Lockit method?
—Brett S.
Sylvain Vervoort replies:
All the methods and formulas used by the Lockit method will be included in my new book, Capturing Profit With Technical Analysis (due out September 2009 from Marketplace Books; information at www.marketplacebooks.com and at https://stocata.org).
However, my Sats2 method is not yet available for sale. I am considering including it in a future book. I am starting a real-time experiment with a few people now to get some real-life feedback on their use of Sats2.
MODIFIED ATR TRAILING STOP
Editor,
I was trying to build a MetaStock function with Sylvain Vervoort’s modified Atr trailing stop from start date but encountered the following error:
Stoplong:=ExtFml(“AdvancedStop.Stoplong”,Entry,Initstop,0,c-Loss,0,0,0,0);
with the following error message: “This Dll does not exist in the Msx Dll folder” at “AdvancedStop.Stoplong.”
I would really appreciate his comment.
— Dan W.
Sylvain Vervoort replies:
I assume you have not installed the AdvancedStop.dll file. This file must be present in the MetaStock folder. The standard installation will be under:
C:\Programfiles\Equis\MetaStock\ExternalFunctionDLLs\AdvancedStop.dll
You can find this file and more information here: https://www.tradernexus.com/advancedstop/advancedstop.html (as mentioned in my May 2009 S&C article, “Using Initial Stop Methods”).
CODE HELP FOR PREMIER STOCHASTIC OSCILLATOR
 Editor,
I am a subscriber to Stocks & Commodities. With the help of a friend, I’ve been trying to get the premier stochastic oscillator described in Lee Leibfarth’s August 2008 S&C article by the same name to work. But in the indicator code, the word/function/indicator stochastic is unrecognized. Same problem with the strategy code, as well as the added errors that one instance of the word “premier” is spelled “premiere” in the value assignment area yet spelled “premier” in the rest of the code — I think that instance is supposed to be “premier.” In addition, in the value assignment area, the premiere value is zero, but there is no “(“ in front of the zero.
Can you or the author help?
—Eric Barelka
Editor Jayanthi Gopalakrishnan replies:
First, you are correct in that “premier” should be spelled “premiere” in the value assignment area. Actually, that “e” at the end is supposed to be the parenthesis — “(“ — that you said was missing. So it should be:
Premier(0);
I suggest you visit the Traders’ Tips section of the August 2008 issue. It contains TradeStation’s updated EasyLanguage code. If you are still having difficulty getting it to run, try posting your question at the TradeStation user forum. Hope this helps.
Author Lee Leibfarth replies:
The indicator and strategy code given in my August 2008 S&C article were written for TradeStation 8. The “stochastic” is an internal function in TradeStation and should be recognized by all version 8 builds. I have included the code below for your reference.
I hope this is helpful.
//-----------------------------------------
  //Premier Stochastic Indicator
inputs:
  Line1(.9),
  Line2(.2),
  StochLength(8),
  Period(25);
  variables:
  color(black),
  oFastK(0),
  oFastD(0),
  oSlowK(0),
  oSlowD(0),
  Length(0),
  NormStoch(0),
  SmoothStoch(0),
  Premiere(0);
  Value1 = Stochastic( h, l, c, StochLength, 1, 3, 1, oFastK, oFastD, oSlowK, oSlowD);
  Length = iff(Period < 0, 1, squareroot(Period));
  NormStoch = .1 * (oslowK - 50);
  SmoothStoch = xaverage(xaverage(NormStoch, Length), Length);
  Premiere = (expValue(1 * SmoothStoch) - 1) / (expValue(1 * SmoothStoch) + 1);
  if Premiere < 0 then color = red else color = blue;
plot1(Premiere, “Premiere”);
  plot2(Premiere, “Histo”, color);
  plot3(Line1, “1”);
  plot4(Line2, “2”);
  plot5(Line1 * -1, “3”);
  plot6(Line2 * -1, “4”);
//-----------------------------------------
  //Premier Stochastic Strategy
inputs:
  StopLoss(800),
  ProfitTarget(1600),
  Line1(-.9),
  Line2(-.2),
  StochLength(8),
  Period(25);
  variables:
  oFastK(0),
  oFastD(0),
  oSlowK(0),
  oSlowD(0),
  Length(0),
  NormStoch(0),
  SmoothStoch(0),
  Premiere(0);
  value1 = Stochastic( h, l, c, StochLength, 1, 3, 1, oFastK, oFastD, oSlowK, oSlowD);
  Length = iff(Period < 0, 1, squareroot(Period));
  NormStoch = .1 * (oslowK - 50);
  SmoothStoch = xaverage(xaverage(NormStoch, Length), Length);
  Premiere = (expValue(1 * SmoothStoch) - 1) / (expValue(1 * SmoothStoch) + 1);
  if Premiere crosses over Line1 or Premiere crosses over Line2 then sellshort
  (“S1 Sell”) next bar at market ;
  if Premiere crosses under Line1 * -1 or Premiere crosses under Line2 * -1
  then buy (“L1 Buy”) next bar at market ;
  setstopcontract;
  setstoploss(StopLoss);
  setprofittarget(ProfitTarget);
//-----------------------------------------
  // Stochastic Function (From TradeStation)
inputs:
  PriceH( numericseries ),
  PriceL( numericseries ),
  PriceC( numericseries ),
  StochLength( numericsimple ),
  Length1( numericsimple ), { this input assumed to be a constant > 0;
  used to slow
  FastK to FastD = SlowK }
  Length2( numericsimple ), { this input assumed to be a constant > 0;
  used to slow
  FastD to SlowD }
  SmoothingType( numericsimple ), { this input is assumed to be
  constant; pass in 1
  for Original, 2 for Legacy }
  oFastK( numericref ),
  oFastD( numericref ),
  oSlowK( numericref ),
  oSlowD( numericref ) ;
variables:
  LL( 0 ), { lowest low }
  HH( 0 ), { highest high }
  Num1( 0 ), { numerator 1 }
  Den1( 0 ), { denominator 1 }
  Num2( 0 ), { numerator 2 }
  Den2( 0 ), { denominator 2 }
  BarsToGo1( 0 ),
  BarsToGo2( 0 ) ;
Stochastic = 1 ;
LL = Lowest( PriceL, StochLength ) ;
  HH = Highest( PriceH, StochLength ) ;
  Num1 = PriceC - LL ;
  Den1 = HH - LL ;
if Den1 > 0 then
  oFastK = Num1 / Den1 * 100
  else
  begin
  oFastK = 0 ;
  Stochastic = -1 ;
  end ;
if SmoothingType = 1 then { Original }
  begin
  BarsToGo1 = Length1 - CurrentBar ;
  if BarsToGo1 > 0 and CurrentBar > 0 then
  begin
  { use approximate “backpropagated” calculations until we have enough data }
  Num2 = ( Cum( Num1 ) + BarsToGo1 * Num1[ CurrentBar - 1 ] ) / Length1 ;
  Den2 = ( Cum( Den1 ) + BarsToGo1 * Den1[ CurrentBar - 1 ] ) / Length1 ;
  end
  else
  begin
  Num2 = Average( Num1, Length1 ) ;
  Den2 = Average( Den1, Length1 ) ;
  end ;
  if Den2 > 0 then
  oFastD = Num2 / Den2 * 100
  else
  begin
  oFastD = 0 ;
  Stochastic = -1 ;
  end ;
  BarsToGo2 = Length2 - CurrentBar ;
  if BarsToGo2 > 0 and CurrentBar > 0 then
  { use approximate “backpropagated” calculations until we have enough data }
  oSlowD = ( Cum( oFastD ) + BarsToGo2 * oFastD[ CurrentBar - 1 ] ) / Length2
  else
  oSlowD = Average( oFastD, Length2 ) ;
  end
  else if SmoothingType = 2 then { Legacy }
  begin
  oFastD = XAverage( oFastK, Length1 ) ;
  oSlowD = XAverageOrig( oFastD, Length2 ) ;
  end ;
oSlowK = oFastD ;
{

  MULTIPLE-OUTPUT FUNCTIONS
  A multiple-output function has two types of parameters or “inputs” - input parameters and input/output parameters.
 The values of the input parameters are passed into the multiple-output function, but not modified by the function.
The values of the input/ output parameters are passed into the multiple-output function, modified by it, and the modified
values are then inherited by - or output to - the calling routine.
The input/output parameters are often used for output purposes only, i.e., the incoming values are ignored. The outputs
are in addition to the function return. In multiple-output functions, the function return is generally used to return
an error code, though sometimes the return may simply be a dummy value.
The input/output parameters are declared with a “ref” suffix (such as “numericref”) in the multiple-output function’s
declaration statements. For further clarity, the names of the input/output parameters are generally prefixed with an
 “o” in the function as well as in all the routines that call the function.
The built-in single-return WRAPPER FUNCTIONS that call the multiple-output functions are specialized calling routines
 designed to offer simplified, alternate pathways to the functionality of the underlying multiple-output functions.
 In the wrapper functions, the input/output parameters are declared as local variables and generally initialized to zero.
They are passed through to the multiple-output function without further modification. After the call, the wrapper
function picks out the single output of interest and assigns it as the return of the wrapper function.
  }
  { ** Copyright (c) 2001 - 2009 TradeStation Technologies, Inc. All rights reserved. **
  ** TradeStation reserves the right to modify or overwrite this analysis technique with each release. ** }
ERRATA: MIDAS TOPFINDER CHARTS
 The figures that appeared in the August 2009 Stocks & Commodities article, “Applying Midas To Daily And Weekly Charts,” by Andrew Coles and David Hawkins contained several errors as follows:
In the lower right area of Figure 2 on page 55 of the August 2009 issue, the second red curve from the bottom (that is, the one that starts at a price of 50) is extraneous.
In Figure 3 on page 58, the label “86” should have read “S6.”
In Figure 6 on page 60, the two uppermost curves, red and purple, are extraneous.
In Figure 7 on page 61, the horizontal axis was inadvertently cut off.
The corrected charts are reprinted here. We regret these errors.—Editor
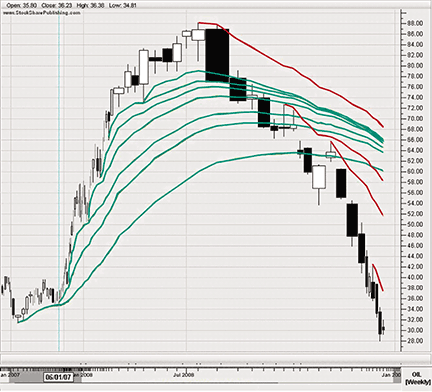
Figure 2: weekly chart of oil, the ipath s&P crude oil total return. Here, MIDAS and TB-F curves plot more smoothly in virtue of cumulative volume in the x-axis instead of time.
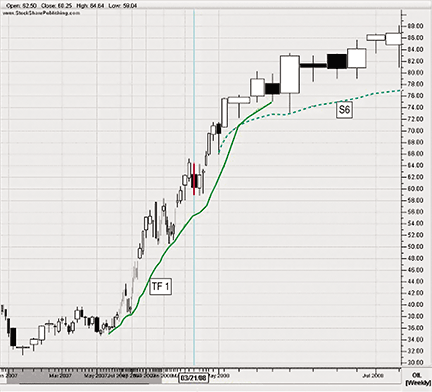
FIGURE 3: Weekly chart of OIL, the iPath S&P Crude Oil Total Return Index. A TB-F curveis fitted to the two pullbacks stradding TF1. On expiration of D, price pulls back briefly to the most proximate MIDAS support curve.
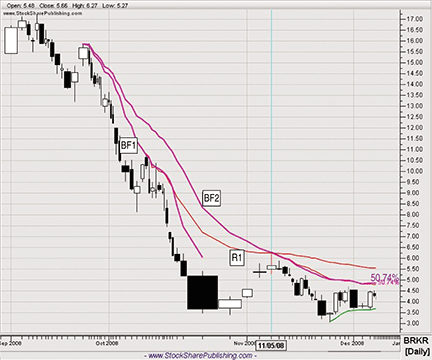
FIGURE 6: BRUKER CORP. (BRKR), A BIOSCIENCE COMPANY. Although the accelerated trend ended on the termination of TB-F1, it failed to penetrate the MIDAS R1 curve. As a result, there was no long entry. Further, the current value of D at 50% done and the active resistance roles of the second MIDAS and TB-F curves means that a long position is out of the question.
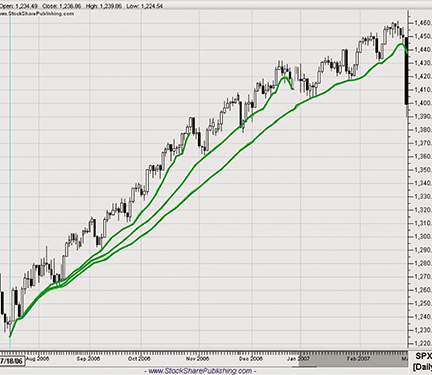
FIGURE 7: DAILY CHART OF S&P 500. Nested TB-F curves can be launched from the same bar when price merely reacts to shorter curves by temporarily pulling back, sometimes to a curve with a higher amount of cumulative volume, before the trend continues.