CHART PATTERNS
Part 3 Of The Price Model Series
Tops And Bottoms
How do you know if the market has formed a top or a bottom? Here we look at the double-top and double-bottom patterns that occur frequently in the markets.
When head & shoulders, double-top/bottom, and triple-top/bottom patterns are discussed, you’ll find that they are referred to as trend reversal patterns. A triple top or bottom is rarer but is really just a version of the head & shoulders pattern. The main difference between the two is that all three peaks (or three troughs) of a triple top or bottom are located at almost the same level. In the event there are two peaks (or troughs), it’s referred to as a double top (or double bottom), respectively.
Often, you’ll find technical analysts having differing opinions about the type of price pattern that’s formed. Some may say it’s a head & shoulders pattern, while others may call it a triple top. This argument is academic, because at the core, both price models are virtually the same.
A famous satirist remarked that a woman once asked him why chicken bouillon cubes are called cubes, when they are really parallelepipeds. That sounds funny, doesn’t it? When it comes to price patterns, the situation is quite similar. As technical analysts, our challenge lies in understanding the core of the price models and the way we can profit from them, regardless of what the price model is called.
The double top
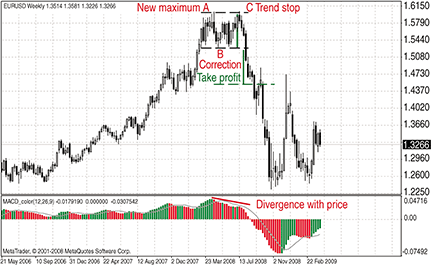
I will consider the features of these models using the double top as an example, since this reversal model occurs most frequently. Please refer to the weekly chart of the Eur/Usd in Figure 1. In an ascending trend, what happens is that price establishes a new maximum (point A). This is usually accompanied by an increase in trading volume. Then there is usually an intermediate fall (point B) with declining volume. So far, everything has gone as you would expect in a typical rising trend.

Figure 1: THE DOUBLE TOP. Price establishes a new maximum, which is usually accompanied by an increase in trading volume. Then price falls to point B with declining volume. During the next rise (from point B to point C), price does not manage to go above the level of the previous peak at A. Prices start falling and as a result you have a potential double-top formation.
During the next rise (from point B to point C), price does not manage to go above the level of the previous peak at A. Prices start falling, and as a result you have a potential double-top formation. I say potential because, as is the case for all reversal models, the reversal is not complete until you are sure that the closing prices cross below the previous support level, or go below point B. Until then, it is premature to consider this to be a trend reversal pattern. It could well be just a consolidation horizontal phase, after which the previous trend will continue developing.