INDICATORS
Improving The Lead
Volume-Weighted Macd Histogram
Find out how the performance of the Macd improves by volume-weighting it.
My goal was to make the Macd-histogram (Macdh) perform better by volume weighting it. It uses three exponential moving averages. So, what’s needed is to volume weight the exponential moving average (Ema). The Ema is widely used because it is more responsive than the simple moving average (Sma). The volume-weighted moving average (Vwma) responds proportionately more to higher-volume trading so it emphasizes significant trading while deemphasizing less-significant, light-volume trading. The goal here is to combine them into one moving average, the volume-weighted exponential moving average (Vwema), using an algorithm that is simple and easy to implement with indicator scripting languages in standard technical analysis programs, such as the Indicator Builder in MetaStock.
EMA from the SMA
The Sma is just the mean of the prices of the last n trading bars. One simply takes the sum of those prices and divides by n. To make the Ema, we start by making the Sma for the first n bars in the dataset. Thereafter, the general formula is:
Percentage * (present bar’s price)
+ (1 - percentage)*(last bar’s Ema)
Where, for an n-period Ema, the percentage is given by 2/(n + 1)
This has the effect of both giving most weight to the most recent bars and of including information from all previous bars with decreasing weights going back in time.

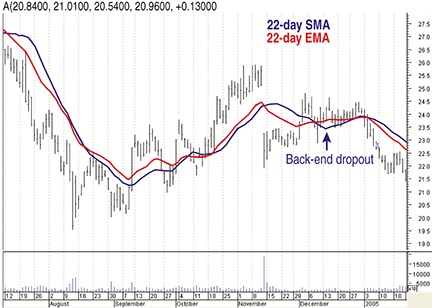
FIGURE 1: COMPARING THE SIMPLE AND EXPONENTIAL MOVING AVERAGES. Here you see the 22-day SMA and the 22-day EMA. Note that the EMA has less lag at the peaks and valleys. Note the huge gap down on large volume that occurred on November 12, 2004. The EMA responds much more quickly to this large change.
Simple vs. exponential
Figure 1 shows the chart of both the 22-day Sma and the 22-day Ema for Agilent Technologies, Inc. (A), in late 2004 to early 2005. Note that the Ema has less lag at the peaks and valleys. Note the huge gap down on large volume that occurred on November 12, 2004. You can see that the Ema responds much more quickly to this large change.
Note the backend dropout effect in the Sma, where the Sma suddenly changes direction, even though the price isn’t doing much of anything in that region of the chart. This is because, at this bar, the November 12th bar drops out of the Sma since it is now 23 bars ago. This backend dropout effect causes the Sma to give a false signal, an effect that is eliminated by using the Ema.