INTERVIEW

“You don’t learn anything when you make money. You only learn when you lose it.”
Probabilities, Not Certainties
Martin Pring And The Relevance Of Price Trends
Martin J. Pring entered the financial markets in 1969 and has grown to become a leader in the global investment community. In 1981 he founded Pring Research and began providing research for financial institutions and individual investors around the world. Since 1984, he has published the Intermarket Review, a monthly market review offering a long-term synopsis of the world’s major financial markets.
He is the author of several outstanding books including Introduction To Technical Analysis, Martin Pring On Market Momentum, and Technical Analysis Explained, now in its fourth edition. Since this book first appeared in 1979, Technical Analysis Explained has established itself as the premier guide of its kind.
Over the past 34 years, his research has led to the development of reliable financial and economic indicators for timely and effective forecasting. Pring’s personal barometers for the bond, stock, and commodity markets have identified major turning points since the 1950s on a timely basis and outperformed the buy/hold approach by a wide margin. He is also chairman of the Pring Turner Capital Group, a conservative money management firm dedicated to allocating assets according to business cycle conditions. He may be reached at pring.com.
Stocks & Commodities Editor Jayanthi Gopalakrishnan (JG) and Staff Writer Bruce Faber (BF) spoke with Martin Pring via the telephone on August 5, 2009.
Martin, how did you get interested in technical analysis?
I started off as a stockbroker in Toronto, Canada, working for a company called AE Ames. They had a great trading program and a great library. In that library was a book titled Technical Analysis Of Stock Trends by Robert Edwards and John Magee, which I found to be absolutely fascinating. It didn’t send me to sleep like it sent most of my friends to sleep. I enjoyed that book tremendously. Then I was promoted to be a manager up in Owen Sound, about 125 miles north of Toronto, and I used technical analysis to sell stocks to my clients. That is how I got interested in technical analysis.
JG: You place a lot of emphasis on economic cycles. What is the link between the stock market and the economic cycles?
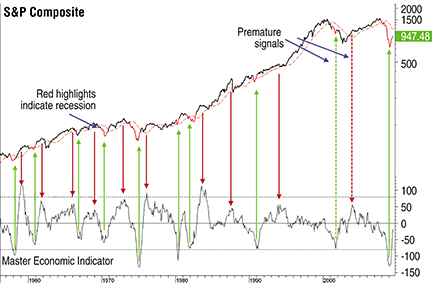
In most cycles, there is a pretty close link between the level of economic activity and where the stock market is. The stock market typically bottoms when downside momentum is greatest in the economy, and to some extent it also peaks when the economic growth pattern is at its height (Figure 1). There are obviously exceptions because there are no perfect rules.

FIGURE 1: ECONOMIC CYCLES. The stock market typically bottoms when downside momentum is greatest in the economy and, to some extent, also peaks when the economic growth pattern is at its height.
Actually, it is very consistent at bottoms, but not so at tops. In the last bottom there was an exception where the economy basically bottomed at the end of 2001, and the stock market did not respond until October 2002, which is why I always like to combine some kind of a trend measurement of the stock market to my economic stuff. I want to make sure that the stock market is responding to favorable or unfavorable conditions, depending on what we are looking at.
JG: What exactly are you looking for? Are you looking for trends? Are you looking for momentum in the markets to determine trend direction?
I look for a number of things. In terms of momentum, I look at key long-term momentum such as that of the S&P dividend yield. I take a momentum of this, a Kst of that, and that has reversed consistently from oversold levels since 1900 or so. With few exceptions, when it has crossed its moving average, it has given very good signals. It did that a couple of months ago.