QUANTITATIVE METHODS
What’s Going To Work For You?
Data Mining And Cubes For Traders
Here’s a technique you can apply that will show you what indicators and combination of indicators will be the most successful.
Business intelligence (BI) is a rapidly growing area of the software market. A major part of the Microsoft BI suite of software is Sql Server Analysis Services (Ssas), a powerful and fully featured application that is transforming how many companies work with and view their data. The aim of Ssas and the other BI tools is to convert raw data into information (that is, meaningful data) and then into intelligence (information that is easily visualized, easily found, and forms the basis for sound decision making). Ssas is ideally suited to the analysis of share and option price movement data, in particular how technical and fundamental and other indicators might predict such movements.
Ssas provides two major objects to assist you in price movement analysis and prediction. These two objects are:
- Multidimensional cubes
- Data mining models
Ssas is on your Sql Server Dvd and there is no cost, provided you install it on the same computer as Sql Server. Microsoft Excel 2007 provides interfaces to view cubes and data mining models built in Ssas. In addition, Excel 2007 can be used to develop temporary and permanent data mining models using Ssas in the background for the heavy lifting. Even if you don’t have Ssas, you can easily connect Excel to Sql Server Data Services (Sds) via an Internet connection — this is analyzing in the cloud. And for those without Excel 2007 or Ssas, it is also now possible to perform data mining in the cloud from Internet Explorer. This article is an overview that explores the potential of BI for traders and gives a few guidelines for getting started with data mining in particular: namely, that cubes require a bit more work.

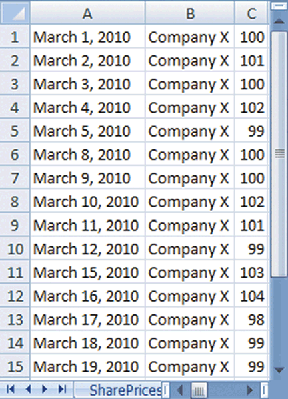
Figure 1: preparing the initial data. You need at least the name or symbol of security, date, and closing price.
Preparing the initial data
This is the vital step. If you get this wrong, then both cubes and data mining will return meaningless or erroneous data. You will need a list of share prices by date and name. In Figure 1 you can see a suggested starting point in an Excel worksheet. Dates can be entered in column A, company name (or symbol) in column B, and closing price in column C. Of course, you will require more data for your results to be statistically viable. Excel 2007 supports just over one million rows in a worksheet so you can have a number of different shares across wide date ranges. If you have well over a million prices to analyze, then you can create multiple worksheets and/or workbooks.