INDICATORS
Where Are We Now?
Looking At The Market With Auction Market Analysis
Here’s a look at the volatile periods in the broader markets going back to 1928. How do they compare to the 2008–09 market? Check it out with Market Profile.
First, what exactly is Market Profile? It is a charting format that displays a horizontal view as well as a vertical one of market development. Initially the brainchild of Peter Steidlmayer and his work of the early to mid-1980s, it is a methodological concept that continues to evolve to this day. Basically, it “explains” the organizational activity of how an auction market works and develops.
The auction market
In 1993, Donald Jones published the book Value Based Power Trading, which presents a statistically rigorous model that expands the original profile concept. In that book Jones based his work and his ongoing research under the umbrella of what he refers to as auction market value theory (Amtv). Amtv posits that in an auction market, a given market unit (the same development process occurs regardless of the degree of time involved, so a unit can be a day or several days, weeks, months, or even years) is driven by a search for value.
Value is ultimately determined by the market participants themselves — the buyers and sellers. The buying and selling conducted by the market participants in a given market auction creates activity in the auction range (a profile “unit”). There is a different amount of activity within the range depending on the relative perception of value, or the lack thereof, by the market participants. Traders will spend the most time and conduct the greatest amount of business at prices considered by both parties to be fair. The least amount of trading between buyers and sellers will occur at prices that are unfair for either the buyer or seller.
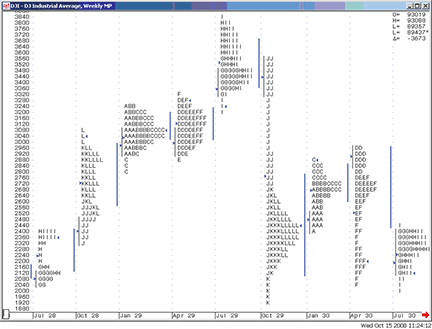
Figure 1: djia, july 1928july 1930. Here you see the runup into the final high subsequent to the 1929 October stock market crash.
When value can be determined, the market will remain in balance and trade in a range. It will be attracted to the area of the range that contains the highest volume, which is logical because that is the area of fairest value to both buyer and seller. When the perception of value changes, the market reaches a state of imbalance and it will trend until a new range is established and the process repeats itself.