CHART PATTERNS
Part 5 Of The Price Model Series
Continuation Price Patterns
Take a look at some of the more common continuation patterns that you find on charts.
Like reversal models (or patterns), continuation models are formed during periods of market instability. These appear when bullish and bearish forces are about equal. As a result, price stops moving in the direction of the trend and starts to fluctuate within a range. The appearance of continuation models usually indicates that the period of price standstill that you see on a chart is nothing more than a pause in the development of the prevailing trend. The trend direction will not change after the consolidation period has ended. This is one feature that distinguishes continuation models from reversal models, which were discussed in earlier articles. Reversal models usually reflect a turnaround in the prevailing trend.
Another difference between a reversal and continuation model is the duration of their formation. Reversal models, which tend to display crucial changes in price dynamics, usually last for a longer time, whereas trend continuation models are relatively shorter.
Continuation patterns
Some of the common continuation patterns are triangles, flags, and pennants. Let’s look at each.
Triangles
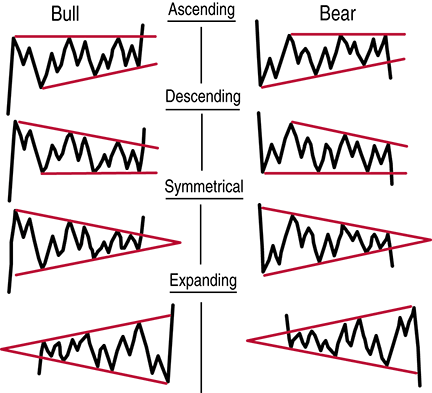
If the range of a price consolidation is limited within support and resistance lines and crosses either of them some time in the near future, the model is known as a triangle. Depending on how the support and resistance lines are arranged, you can have symmetrical triangles, ascending triangles, descending triangles, and expanding triangles (Figure 1). For the pattern to be valid, there must be at least two points at the resistance level and two points at the support level.

Figure 1: different types of triangles. Here’s how ascending, descending, symmetrical, and expanding triangles theoretically look.
However, there are variations to this theory. Some prefer to see three points at the resistance and support levels. Although the triangle was originally accepted as a continuation model, today many analysts share the opinion that this model can be more appropriately described as neutral. What this means is that, as experience shows, a price breakthrough can occur in the direction of the current trend and against it. While you are working with any price model, your challenge is to wait till a clear price range is formed before you join the movement.