TRADING SYSTEMS
Reliability Is Harder Than It Looks
The Vortex Indicator
The search for a reliable technical indicator for trading a change in market direction seems to be a never-ending quest. Ideally, such an indicator should be on time; neither lagging the market nor too sensitive. The Vortex Indicator was developed as a new directional movement indicator, drawing inspiration in part from J. Welles Wilder’s directional movement indicator. The result is a simple but effective indicator that can be used to develop intriguing trading ideas.
After thoroughly researching technical tools, we concluded that the concept of the directional movement index (Dmi) offered the most accurate way to identify trend direction or significant price moves in the market. The concept of Dmi was best defined and described by J. Welles Wilder in his classic 1978 book New Concepts In Technical Trading Systems. The result of his work is the now-famous and highly effective indicator, which inspired the creation of our Vortex Indicator.
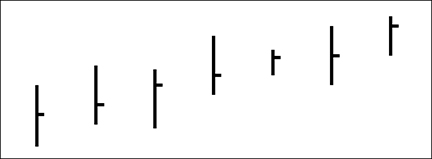
To understand the Vortex Indicator better, we must describe directional movement. The idea is that the individual relationship between price bars provides clues to the direction of the trend or market. Wilder summed it up thus: “Directional movement is the largest part of today’s range that is outside yesterday’s range.”
Positive directional movement is simply the portion of a price bar that is above the high of the previous bar. Negative directional movement is the portion of the price bar that is lower than the previous low. The smaller of these two values is assigned a zero value. The larger number is used to indicate if the market is moving up (positive) or down (negative). In the case of an inside bar (if neither the high nor the low is higher or lower than the previous bar), a zero value is assigned to both positive and negative direction.
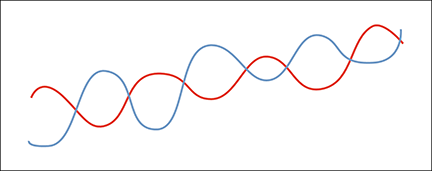
The result will be a string of seemingly random consecutive zeroes or positive numbers placed in two columns assigned for positive and negative directional movement. However, if these two strings of numbers are summed after 14, 21, or 55 periods, the larger value gives an indication of overall trend. If this process is continued, the result can be seen on a chart as two lines representing positive and negative directional movement. These will intersect and cross during a change of trend and diverge wider and wider as the strength of the trend increases. This is the basis of Wilder’s Dmi.

Figure 1: a typical vortex flow
Inspiration from nature
The Vortex Indicator’s inspiration for another view on directional movement comes from an entirely different source. Viktor Schauberger (1885–1958), who is viewed as the father of “implosion technology,” was an Austrian forester, experimenter, and inventor. He sought to develop energy-producing machines that, through their shape, form, and motion, were able to mimic the power of nature’s processes. The foundation of his work came from studying nature and analyzing the fluidic vortexes of water in rivers and streams, and later in pipes and turbines.

Figure 2: vortex flows in the markets