TRADING SYSTEMS
Focusing On Real-World Techniques
The Search For Your Trading Style
Here’s a simple trading method you can apply if you trade with a longer-term outlook.
I hope my recent article, “Crash Course For Novice Traders,” caused you to reflect on the critical decisions that you’ll need to make before pursuing an aggressive program of trading or investing. If you haven’t read the article yet and you’re struggling to stay afloat as a trader and/or investor, consider taking a few minutes now and read that article, as it may help you locate significant areas of deficiency in your overall trading plan.
A plan with a long-term outlook
This time, I want to lay out the basics of a particular style of trading that may be suitable for investors and traders with a long-term outlook on the markets they follow. “Trend-following” is the term assigned to this mode of trading, a style that relies on mechanical system entry/exit triggers to open and close a trading position. Normally, the goal of a trend-follower is to stay in a trade as long as possible, relying on mechanical entries/exits to determine the holding period; normally, trend-followers don’t set price targets or scale out of winning trades, preferring to stay with their well-tested trend-following systems to make all of the decisions.
Trend-following (TF) can be a very profitable way to trade, particularly when a TF entry signal results in a 100%, 200%, or even 500% gain on a low-priced stock or commodity, one that embarks on a multimonth (multiyear) trending move to astounding price levels. Conversely, for the trader/investor relying on such methods, TF systems can also be frustrating, even nerve-wracking at times, especially since many TF systems sport win ratios of only 30–45%, and periods of system drawdown (DD) can last for extended periods of time. Nevertheless, there are many examples of successful TF systems that make consistently good money over long periods of time.

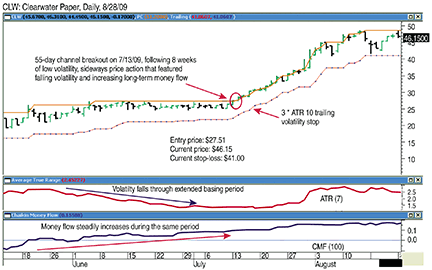
Figure 1: trading a flat base breakout. Note the period of sideways price action that lasted about eight weeks. Also note the 55-day price channel breakout on July 13, 2009 — an indication of a strong chance of a trending move in the stock price.