CHART PATTERNS
Understanding Market Data
Crude Oil And Candlesticks
The rise and fall of oil prices have a global effect on all aspects of the markets. Here we look at this historical price movement through the eyes of candle patterns.
The underlying psychology of market sentiment is a complex structure. It is difficult to understand and more difficult to explain. Fundamental analysis can be best expressed through words, interpreting how new information might bring about change in market price, while technical analysis uses mathematics to explain price movement. All market analysts distill information from which they formulate their assumptions. The master market technicians will use a mixture of both for successful trading.
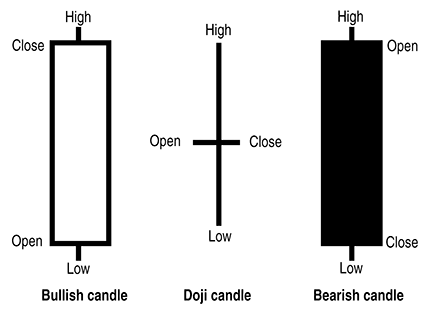
What we call Japanese candlestick charts and patterns are the results of a trading system created hundreds of years ago and refined into its current form. The Japanese technician was one of the first to describe market sentiment as a battle between the bulls and bears. The outcome of the battle can be mathematically expressed as a single candlestick.
Trader’s attitude
The candlestick technique teaches us to identify the trader’s attitude about the market. It is one of our earliest attempts to explain how traders believe a market will act. These patterns are the culmination of the original concept that over time were turned into identifiable patterns. By learning to identify these patterns, you can discover a systematic approach to recognizing both trends and reversals of the price of any stock or commodity.
The formations identified in candlestick patterns are based upon the sakata method, derived from the 160 rules that Sokyu Honma, credited to be the developer of the candlestick technique, created to guide his trading, as revealed in his work, The Fountain Of Gold: The Three-Monkey Record Of Money. He suggested that traders’ emotions have a considerable influence on price. This is where he suggested using the characteristics of the famous three monkeys:
- See no evil. When you see a trend, do not assume the continuation of its direction; it could be an opportunity for a reversal.
- Hear no evil. When you hear news, do not trade on it.
- Speak no evil. Do not discuss what you are about to do in the market.
It is from this work that candlestick charting and their patterns originate. Honma first wrote of the sakata five-method, five pattern groups based on the number three: Three mountains, three rivers, three gaps, three soldiers, and the three method. Over time these concepts evolved into the candlestick patterns taught to traders today.

Figure 1: long sessions. The range between the opening and closing prices is larger than in the preceding five to 10 days.