TRADERS’ TIPS
February 2010
Here is this month’s selection of Traders’ Tips, contributed by various developers of technical analysis software to help readers more easily implement some of the strategies presented in this and other issues.
Other code appearing in articles in this issue is posted in the Subscriber Area of our website at https://technical.traders.com/sub/sublogin.asp. Login requires your last name and subscription number (from mailing label). Once logged in, scroll down to beneath the “Optimized trading systems” area until you see “Code from articles.” From there, code can be copied and pasted into the appropriate technical analysis program so that no retyping of code is required for subscribers.
You can copy these formulas and programs for easy use in your spreadsheet or analysis software. Simply “select” the desired text by highlighting as you would in any word processing program, then use your standard key command for copy or choose “copy” from the browser menu. The copied text can then be “pasted” into any open spreadsheet or other software by selecting an insertion point and executing a paste command. By toggling back and forth between an application window and the open web page, data can be transferred with ease.
This month’s tips include formulas and programs for:
- TRADESTATION: 350 SWING INDICATOR
- METASTOCK: 350 SWING INDICATOR
- WEALTH-LAB: 350 SWING INDICATOR
- AMIBROKER: 350 SWING INDICATOR
- WORDEN BROTHERS STOCKFINDER: 350 SWING INDICATOR
- NEUROSHELL TRADER: 350 SWING INDICATOR
- AIQ: 350 SWING INDICATOR
- TRADERSSTUDIO: 350 SWING INDICATOR
- STRATASEARCH: 350 SWING INDICATOR
- TRADECISION: 350 SWING INDICATOR
- NINJATRADER: 350 SWING INDICATOR
- NEOTICKER: 350 SWING INDICATOR
- WAVE59: 350 SWING INDICATOR
- INVESTOR/RT: 350 SWING INDICATOR
- TRADE NAVIGATOR: 350 SWING INDICATOR
- UPDATA: 350 SWING INDICATOR
- ENSIGN WINDOWS: 350 SWING INDICATOR
- TRADE IDEAS: 350 SWING INDICATOR
- eSIGNAL: 350 SWING INDICATOR — ARTICLE CODE
![]() TRADESTATION: 350 SWING INDICATOR
TRADESTATION: 350 SWING INDICATOR
Barbara Star’s article in this issue, “The 350 Swing Trade,” outlines several trading systems based on J. Welles Wilder’s relative strength index (Rsi).
Star’s analysis can be performed in TradeStation using two calculations: a three-bar Rsi, and a smoothed three-bar Rsi. Wilder’s Rsi is a study that is built into TradeStation. To get Star’s three-bar Rsi, you change the Rsi indicator’s “Length” input from 14 (its default value) to 3, and set the two inputs named “oversold” and “overbought” both to 50.
EasyLanguage code for Star’s smoothed Rsi (AvgRsi Alert), price bar coloring (RSI_Trend), and swing alert technique is provided below.
Finally, Star outlines a number of trading systems. The swing 350 system is based on the three-bar Rsi. Star suggests combining the smoothed Rsi with any of the following: a trend-establishing moving average; Wilder’s average directional movement indicator (Adx); or Bollinger bands. Strategy code for some of these combinations is also presented here.
To download the adapted EasyLanguage code, go to the TradeStation and EasyLanguage Support Forum (https://www.tradestation.com/Discussions/forum.aspx?Forum_ID=213). Search for the file “Swing350.eld.”
A sample chart is shown in Figure 1.
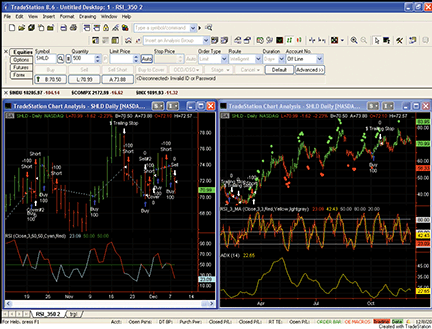
Figure 1: TRADESTATION, SWING 350 SYSTEM. Here are two charts of Sears Holding Corporation (SHLD) stock. Both charts have their price bars shaded red or green by the RSI Trend PaintBar study. The left chart has Barbara Star’s swing 350 system applied. The lower left-pane shows the standard RSI indicator, configured to use a three-bar RSI length. The right chart shows red and green dots above or below certain price bars. These dots are generated by the AvgRSI Alerts indicator. Trades (up and down arrows) on this chart are generated by the AvgRSI with ADX strategy. The right middle pane displays the AvgRSI indicator. The standard ADX indicator is shown the lower pane on the right side.
This article is for informational purposes. No type of trading or investment recommendation, advice, or strategy is being made, given, or in any manner provided by TradeStation Securities or its affiliates.
PaintBar:  RSI Trend
inputs:  Price( Close ), Length( 3 ) ;
variables:  ColorToUse( 0 ) ;

if RSI( Price, Length ) > 50 then
	ColorToUse = Green
else
	ColorToUse = Red ;

PlotPaintBar( High, Low, Open, Close, "RSI_3",
 ColorToUse ) ;


Indicator:  AvgRSI
inputs:
	Price( Close ),
	Length( 3 ),
	Smoothing( 3 ),
	RSI_Color( Yellow ),
	RSI_MA_Color( Red ) ,
	MidpointColor( LightGray ) ;

variables:
	RSIValue( 0 ),
	RSI_MA( 0 ) ;

RSIValue = RSI( Price, Length ) ;
RSI_MA = Average( RSIValue, Smoothing ) ;

Plot1( RSIValue, "RSI", RSI_Color ) ;
Plot2( RSI_MA, "RSI_MA", RSI_MA_Color ) ;
Plot3( 50, "MidPoint", MidpointColor ) ;
Plot4( 80, "Upper", MidPointColor ) ;
Plot5( 20, "Lower", MidPointColor ) ;


Indicator:  AvgRSI Alert
inputs:
	Price( Close ),
	Length( 3 ),
	Smoothing( 3 ),
	OffsetPct( 10 ) ;

variables:
	intrabarpersist OBMultiplier( 0 ),
	intrabarpersist OSMultiplier( 0 ),
	RSI_MA( 0 ) ;

Once
	begin
	OBMultiplier = 1 + 0.01 * OffsetPct ;
	OSMultiplier = 1 - 0.01 * OffsetPct ;
	end ;

RSI_MA = Average( RSI( Price, Length ), Smoothing ) ;

if CurrentBar > Smoothing then
	if RSI_MA > 80 then
		Plot1( Close * OBMultiplier, "OverBought" )
	else if RSI_MA < 20 then
		Plot2( Close * OSMultiplier, "OverSold" ) ;


Strategy:  Swing350
inputs:  Price( Close ), Length( 3 ), TrailingAmt( 3 ) ;
variables:  StopPrice( 0 ),	RSIValue( 0 ) ;

RSIValue = RSI( Price, Length ) ;

if MarketPosition = 1 and StopPrice > 0 then
	Sell next bar at StopPrice stop
else if MarketPosition = -1 and StopPrice > 0 then
	BuyToCover next bar StopPrice stop ;

if RSIValue crosses over 50 then
	begin
	Buy next bar market ;
	StopPrice = Low[1] ;
	Sell next bar at StopPrice stop ;
	end
else if RSIValue crosses under 50 then
	begin
	SellShort next bar at market ;
	StopPrice = High[1] ;
	BuyToCover next bar StopPrice stop ;
	end ;

SetStopShare ;
SetDollarTrailing( TrailingAmt ) ;


Strategy:  AvgRSI
inputs:
	Price( Close ),
	RSI_Length( 3 ),
	RSI_Smoothing( 3 ),
	OverSold( 20 ),
	OverBought( 80 ),
 	TrailingAmt( 3 ) ;

variables:
 	RSI_MA( 0 ) ;

RSI_MA = Average( RSI( Price, RSI_Length ),
 RSI_Smoothing ) ;

if RSI_MA crosses over OverSold then
	Buy next bar market
else if RSI_MA crosses under OverBought then
	SellShort next bar at market ;

SetStopShare ;
SetDollarTrailing( TrailingAmt ) ;


Strategy:  AvgRSI W/Trend
inputs:
	Price( Close ),
	RSI_Length( 3 ),
	RSI_Smoothing( 3 ),
	TrendLength( 50 ),
	OverSold( 20 ),
	OverBought( 80 ),
 	TrailingAmt( 3 ) ;

variables:
	AvgValue( 0 ),
 	RSI_MA( 0 ) ;

RSI_MA = Average( RSI( Price, RSI_Length ),
 RSI_Smoothing ) ;
AvgValue = Average( Price, TrendLength ) ;

if RSI_MA crosses over OverSold and Close > AvgValue
 then
	Buy next bar market
else if RSI_MA crosses under OverBought and Close <
 AvgValue then
	SellShort next bar at market ;

SetStopShare ;
SetDollarTrailing( TrailingAmt ) ;


Strategy:  AvgRSI W/BBand
inputs:
	Price( Close ),
	RSI_Length( 3 ),
	RSI_Smoothing( 3 ),
	BollingerLength( 20 ),
	NumDevs( 1 ),
	OverSold( 20 ),
	OverBought( 80 ),
	TrailingAmt( 3 ) ;

variables:
	RSI_MA( 0 ),
	UpperBand( 0 ),
	LowerBand( 0 ) ;

RSI_MA = Average( RSI( Price, RSI_Length ),
 RSI_Smoothing ) ;

UpperBand = BollingerBand( Price, BollingerLength,
 NumDevs ) ;

LowerBand = BollingerBand( Price, BollingerLength,
 -1 * NumDevs ) ;

if RSI_MA crosses over OverSold and Close crosses over
 LowerBand then
	Buy next bar market
else if RSI_MA crosses under OverBought and Close
 crosses under UpperBand then
	SellShort next bar at market ;

SetStopShare ;
SetDollarTrailing( TrailingAmt ) ;


Strategy:  AvgRSI w/ADX
inputs:
	Price( Close ),
	RSI_Length( 3 ),
	RSI_Smoothing( 3 ),
	ADXLength( 14 ),
	OverSold( 20 ),
	OverBought( 80 ),
 	TrailingAmt( 3 ) ;

variables:
	ADXValue( 0 ),
 	RSI_MA( 0 ) ;

RSI_MA = Average( RSI( Price, RSI_Length ),
 RSI_Smoothing ) ;

ADXValue = ADX( ADXLength ) ;

if ADXValue < 20 then
	if RSI_MA crosses over OverSold then
		Buy next bar market
	else if RSI_MA crosses under OverBought then
    		SellShort next bar at market ;

SetStopShare ;
SetDollarTrailing( TrailingAmt ) ;
![]() METASTOCK: 350 SWING INDICATOR
METASTOCK: 350 SWING INDICATOR
Barbara Star’s article in this issue, “The 350 Swing Trade,” discusses a trading methodology built around a three-period Rsi. The methodology includes combining several indicators, coloring the price bars, and placing diamonds above and below the price bars.
Almost all the indicators needed to recreate her technique are built into MetaStock. The Rsi 3 is the standard Rsi set to use three time periods. The Rsi MA is a three-period simple moving average of the Rsi 3. To recreate it in MetaStock, follow these steps :
- In the Tools menu, select Indicator Builder
- Click New to open the Indicator Editor for a new indicator
- Type the name “RSI MA”
- Click in the larger window and paste or type in the formula:
Mov(RSI(3),3,S)
Of the other indicators suggested in the article to complement this system, only the Donchian channels are not built in. These channels can be added with the following formula:
- In the Tools menu, select Indicator Builder
- Click New to open the Indicator Editor for a new indicator
- Type the name “Donchian channels”
- Click in the larger window and paste or type in the formula:
x:= Input("periods",2,100,20); HHV(H,x); LLV(L,x); (HHV(H,x)+LLV(L,x))/2 - Click OK to close the Indicator Editor.
The coloring of the price bars and the diamonds can be done with an expert advisor. The expert advisor can be created with the following steps:
- Select Tools > Expert Advisor
- Click New to open the Expert Editor
- Type in the name “350 swing trade”
- Click the Highlights tab
- Click New to create a new symbol
- Type in the name “Oversold”
- Set the Color to “green”
- Click in the condition window and type in the formula:
RSI(3)>50
- Click OK
- Click New to create a new highlight
- Type in the name “Overbought”
- Set the Color to “red”
- Click in the condition window and type in the formula:
RSI(3)<50
- Click OK
- Click the Symbols tab
- Click New to create a new symbol
- Type in the name “350 swing alert long”
- Click in the condition window and type in the formula:
Mov(RSI(3),3,S)<20
- Select the Graphics tab
- Set the symbol to the diamond
- Set the color to green
- Set the symbol position to “Below price plot”
- Set the label position to “Below symbol”
- Click OK
- Click New to create a new symbol
- Type in the name “350 swing alert short”
- Click in the condition window and type in the formula:
Mov(RSI(3),3,S)>80
- Select the Graphics tab
- Set the symbol to the diamond
- Set the color to red
- Set the symbol position to “Above price plot”
- Set the label position to “Above symbol”
- Click OK
- Click OK to close the Expert Editor.
![]() WEALTH-LAB: 350 SWING INDICATOR
WEALTH-LAB: 350 SWING INDICATOR
We recreated and plotted the 350 swing indicator per the specifications in Barbara Star’s article in this issue, “The 350 Swing Trade,” though the details of applying it in a strategy required a bit of artistic license.
Concentrating on the swing indicator during upward trends determined by a three-pole 50-period Gaussian (more responsive than an exponential moving average), we used the 350 alerts as a setup for both the entries and exits. An entry is triggered when price reaches the highest high of the previous two bars after an Smarsi(3) below 20, whereas the exit occurs at the close of the bar on which the low reaches the lowest low of the previous two bars. This trigger strategy often entered and exited a prospective trade one bar earlier than waiting for the indicator to cross the 20/80 levels in the opposite direction. To protect against unforeseen disasters, we implemented a 5% stop-loss. While the Donchian channels discussed in Star’s article weren’t used in this trading strategy, they are plotted in our sample chart in Figure 2 for reference.
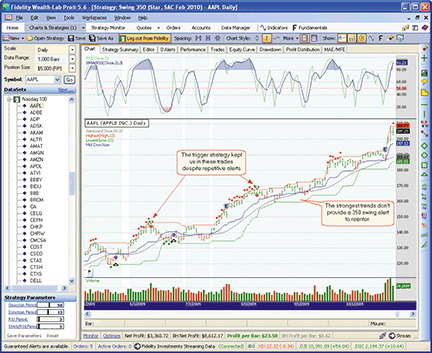
Figure 2: WEALTH-LAB, 350 SWING INDICATOR. This swing strategy works well to capture the meaty part of swings, but in strong trends it can leave you out of the most profitable trades.
WealthScript Code (C#):

using System;
using System.Collections.Generic;
using System.Text;
using System.Drawing;
using WealthLab;
using WealthLab.Indicators;
using TASCIndicators;

namespace WealthLab.Strategies
{
   public class Swing350 : WealthScript
   {
      private StrategyParameter rsiPer;
      private StrategyParameter smaPer;
      private StrategyParameter donchPer;
      private StrategyParameter gaussPer;

      public Swing350()
      {
         gaussPer = CreateParameter("Gaussian Period",50,10,100,5);
         donchPer = CreateParameter("Donchian Period",13,8,21,1);
         rsiPer = CreateParameter("RSI Period",3,2,21,1);
         smaPer = CreateParameter("SMA(RSI)Period",3,2,21,1);
      }
      protected override void Execute()
      {
         bool longSetup = false;
         bool sellSetup = false;

         Font font = new Font("Wingdings", 8, FontStyle.Bold);
         string diamond = Convert.ToChar(0x0077).ToString();

         // Create and Plot Indicators
         DataSeries gauss = Gaussian.Series(Close, gaussPer.ValueInt, 3);   // 3 poles
         DataSeries rsi = RSI.Series(Close, rsiPer.ValueInt);
         DataSeries smaRsi = SMA.Series(rsi, smaPer.ValueInt);
         DataSeries upper = Highest.Series(High, donchPer.ValueInt);
         DataSeries lower = Lowest.Series(Low,donchPer.ValueInt);
         DataSeries mid = (upper + lower) / 2d;
         mid.Description = "Mid Donchian";

         ChartPane paneRSI = CreatePane(40,true,true);
         PlotSeries(paneRSI, rsi,Color.FromArgb(128,0,128,0), LineStyle.Solid, 1);
         PlotSeriesOscillator(paneRSI, smaRsi,80,20,Color.FromArgb(63,0,0,255),Color.FromArgb(63,255,0,0),Color.FromArgb(255,0,0,128),LineStyle.Solid, 1);
         DrawHorzLine(paneRSI, 50, Color.Pink, WealthLab.LineStyle.Dashed, 2);

         PlotSeries(PricePane,gauss,Color.Gray,LineStyle.Solid,1);
         PlotSeries(PricePane,upper,Color.Red,LineStyle.Dashed,1);
         PlotSeries(PricePane,lower,Color.Green,LineStyle.Dashed,1);
         PlotSeries(PricePane,mid,Color.Blue,LineStyle.Solid,1);
         PlotStops();


         for(int bar = GetTradingLoopStartBar(1); bar < Bars.Count; bar++)
         {
            bool trendBullish = gauss[bar] - gauss[bar - gaussPer.ValueInt / 2] > 0
                  && gauss[bar] > gauss[bar - 2];
            if (trendBullish) SetBackgroundColor(bar, Color.Azure);

            // Color bars.  OHLC Bar chart recommended!
            if (smaRsi[bar] < 50)
               SetBarColor(bar, Color.Red);
            else if (smaRsi[bar] >= 50)
               SetBarColor(bar, Color.Green);

            // Draw the Alert diamonds
            if (smaRsi[bar] > 80)
            {
               AnnotateBar(diamond, bar, true, Color.Red, Color.Transparent, font);
               sellSetup = true;
            }
            else if (smaRsi[bar] < 20)
            {
               AnnotateBar(diamond, bar, false, Color.Green, Color.Transparent, font);
               longSetup = true;
            }

            if (IsLastPositionActive)
            {
               longSetup = false;
               Position p = LastPosition;
               if (Close[bar] < p.RiskStopLevel)
                  SellAtClose(bar, p, "Stop");
               else if (sellSetup)
               {
                  if (Low[bar] < Lowest.Series(Low, 2)[bar - 1])
                     SellAtClose(bar, p, "Swing");
               }
            }
            else if (trendBullish)
            {
               sellSetup = false;
               RiskStopLevel = Highest.Series(High, 2)[bar - 1] * 0.95;
               if (longSetup ) BuyAtStop(bar + 1, Highest.Series(High, 2)[bar - 1]);
            }
         }
      }
   }
}
![]() AMIBROKER: 350 SWING INDICATOR
AMIBROKER: 350 SWING INDICATOR
In “The 350 Swing Trade” in this issue, author Barbara Star presents a new application of the classic Rsi (relative strength index) for short-term trading.
Coding for Star’s 350 swing trade technique is easy and straightforward since it uses the built-in Rsi and averaging functions. A ready-to-use formula for the indicator is presented in Listing 1. To use it, enter the formula in the Afl Editor, then press the Insert Indicator button.
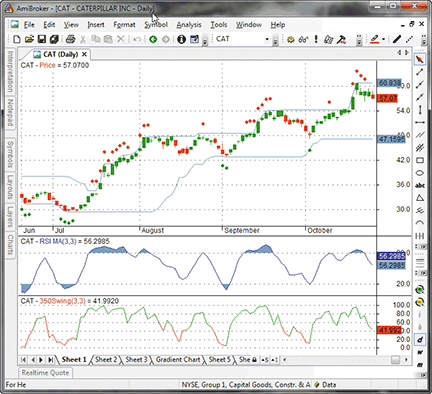
Figure 3: AMIBROKER, 350 SWING INDICATOR. This chart demonstrates three display modes for Barbara Star’s 350 swing indicator: a color-coded candlestick chart of Caterpillar (CAT) with a 20-day Donchian channel (upper pane); a three-day moving average of a three-day RSI (middle pane); and a color-coded three-day RSI (bottom pane).
To display an AmiBroker chart similar to the one shown in Figure 3, press “Insert Indicator” three times; this will create three chart panes. Then click on the chart with your right mouse button and choose “Parameters” from the context menu to select display mode. You can choose either “Rsi,” “Rsi MA,” or “candlestick price chart” with dots marking areas where Rsi MA is above 80 or below the 20 level.
LISTING 1
// 350 Swing Indicator
_SECTION_BEGIN("350Swing");

nRSILen = Param("RSI Length", 3, 2, 50 );
nMALen = Param("MA Length", 3 );
UpColor = ParamColor("UpColor", colorGreen );
DnColor = ParamColor("DnColor", colorRed );

r = RSI( nRSILen );
rma = MA( r, nMALen );
Color = IIf( r > 50, UpColor, DnColor );

mode =  ParamList("Display", "RSI|RSIMA|Price");

switch( mode )
{
case "RSI":
         Plot( r, _DEFAULT_NAME(), Color );
         break;
case "RSIMA":
         Plot( rma,  "RSI MA" + _PARAM_VALUES(), colorBlue );
         PlotOHLC( 50, rma, 50, rma, "", colorLightBlue , styleCloud | styleClipMinMax, 20, 80 );
         break;
case "Price":
         SetBarFillColor( Color );
         Plot( C, "Price", Color, styleCandle );
         PlotShapes( ( rma < 20 ) * shapeSmallCircle, colorGreen, 0, L, -20 );
         PlotShapes( ( rma > 80 ) * shapeSmallCircle, colorRed, 0, H, 20 );
         Plot( HHV( H, 20 ), "", colorLightBlue );
         Plot( LLV( L, 20 ), "", colorLightBlue );
         break;
}
_SECTION_END();
![]() WORDEN BROTHERS STOCKFINDER: 350 SWING INDICATOR
WORDEN BROTHERS STOCKFINDER: 350 SWING INDICATOR
The 350 swing trade setup presented by Barbara Star in her article in this issue is easy to set up in StockFinder using a combination of RealCode and indicators from the vast indicator library.
RealCode is based on the Microsoft Visual Basic.Net framework and uses the Visual Basic (VB) language syntax. RealCode is compiled into a .Net assembly and run by the StockFinder application. Unlike the scripting language that some other trading applications use, RealCode is fully compiled and runs at the same machine-language level as the application itself for the highest speed possible while still allowing the flexibility of “run-time development and assembly.”
Here is the code for coloring the price bars based on the value of Wilder’s Rsi:
'# WR = indicator.Library.Wilders RSI

PlotColor = Color.Gray

If WR.Value > 50 Then
	plotcolor = color.Lime
Else If WR.Value < 50 Then
	plotcolor = color.Red
End If
Wilder’s Rsi is imported into the code editor using the Import Indicator button. “PlotColor = Color.Gray” is the base color to be used if a price bar does not meet any of the other conditional coloring criteria.
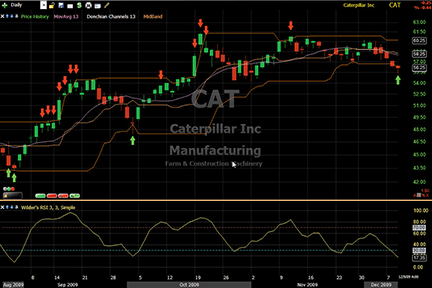
Figure 4: STOCKFINDER, 350 Swing Trade. The candles are colored green when RSI > 50 and red when RSI < 50. The true markers (up/down arrows) are displayed when RSI (3,3) is above 80 (red) or below 20 (green).
The true markers (up/down arrows) on the chart that display when Rsi (3,3) is above 80 or below 20 do not require writing any code. Just click the Add Indicator/Condition button, choose Wilder’s Rsi to add this plot to the chart, and set the Rsi period and average periods to 3. Then right-click on the plot and select “Create condition.” Set the first condition to “Greater than value, 80,” and then repeat, setting the second condition to “Less than value, 20.”
Once you have the Rsi > 80 and Rsi < 20 conditions on the chart, you can right-click on each to turn on the true markers (Figure 4).
To use the indicators, rules, and charts described here, you will need the StockFinder software. To download the software or get a free trial, go to www.StockFinder.com.
![]() NEUROSHELL TRADER: 350 SWING INDICATOR
NEUROSHELL TRADER: 350 SWING INDICATOR
The 350 swing indicator and alerts described by Barbara Star in her article in this issue can be easily implemented in NeuroShell Trader by combining a few of NeuroShell Trader’s 800+ indicators. To recreate the indicators, select “New Indicator …” from the Insert menu and use the Indicator Wizard to set up the following indicators:
350 SWING INDICATOR:
     RSI( Close, 3 )

350 SWING ALERTS:
     CrossAbove( MovAvg( RSI( Close, 3), 3 ), 20 )
     CrossBelow( MovAvg( RSI( Close, 3), 3 ), 80 )
To recreate the 350 swing indicator trading system, select “New Trading Strategy …” from the Insert menu and enter the following in the appropriate locations of the Trading Strategy Wizard:
BUY LONG CONDITIONS:
A>B(Close,ExpAvg(Close,50))
A>B(Sum(CrossAbove(Avg(RSI(Close,3),3),20),10),0)
A>B(RSI(Close,3),0)

LONG TRAILING STOP PRICES:
TrailPrice%(Trading Strategy,10)

SELL LONG CONDITIONS:
AB(Sum(CrossBelow(RSI(Close,3),80),10),0)
AB(RSI(Close,3),50)
If you have NeuroShell Trader Professional, you can also choose whether the system parameters should be optimized. After backtesting the trading strategy, use the “Detailed Analysis …” button to view the backtest and trade-by-trade statistics for the system.
A sample chart is shown in Figure 5.
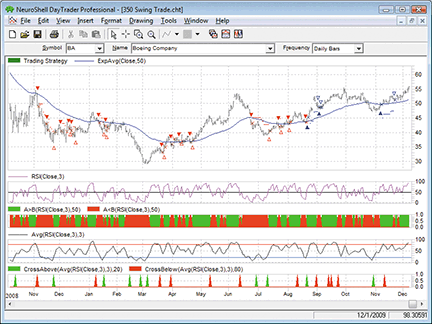
Figure 5: NEUROSHELL TRADER, 350 SWING INDICATOR. Here is the 350 swing indicator and alert system on a NeuroShell Trader chart.
![]() AIQ: 350 SWING INDICATOR
AIQ: 350 SWING INDICATOR
The Aiq code is given here for the 350 swing indicator presented in Barbara Star’s article in this issue, “The 350 Swing Trade.”
The coded version that I am presenting here (Tfs, for “three fifty swing”) includes a system that can be used to test the indicator. The system uses only the author’s 350 swing indicator. To test the indicator in comparison to the original Rsi indicator developed by J. Welles Wilder, I devised a simple system based the overbought and oversold levels that Star suggests.
The rules for this long-only system are to go long when the Tfs is below the lower level (20). The long positions are then exited when the Tfs is above the upper level. When the averaging parameter (maLen) is set to 1, the system is using the standard Rsi.
I used the Portfolio Manager module to simulate trading a portfolio of stocks from the Nasdaq 100. I set the capitalization rules to invest 10% into each stock, taking no more than three new trades per day with up to 10 open positions at one time. When there were more than three signals per day, the ones with the highest relative strength values based on the Aiq relative strength report formula were chosen. All trades were simulated as placed “next day market on open.”
In Figure 6, I show a comparison of the equity curve for the Tfs versus the equity curve for the standard Rsi over the test period from December 31, 1998, through December 8, 2009. The red line is the equity curve from the original Rsi system, while the blue line is the Tfs system. Clearly, Barbara Star’s Tfs indicator was the better performer during this period.
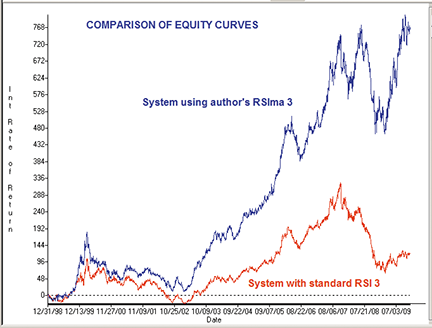
Figure 6: AIQ SYSTEMS, SYSTEM EQUITY CURVE COMPARISON, TFS VS. RSI. Here is a comparison of the equity curve for the 350 swing indicator (TFS) system (blue line) versus the equity curve for the standard RSI system (red line) during the period 12/31/1998 to 12/8/2009 trading long only using the NASDAQ 100 list of stocks.
The code can be downloaded from the Aiq website at www.aiqsystems.com and also from www.TradersEdgeSystems.com/traderstips.htm.
! THE 350 SWING TRADE
! Author: Barbara Star, TASC February 2010
! Coded by: Richard Denning 12/08/09
! www.TradersEdgeSystems.com

! PARAMETERS:
   rsiLen is 3.
   maLen is 3.
   upperLine is 80.
   lowerLine is 20.

! RSI WILDER INDICATOR:
!  Wilder averaging to exponential averaging:
!  ExponentialPeriods = 2 * WilderPeriod - 1.
   U 	is [close]-val([close],1).
   D 	is val([close],1)-[close].
   rsiLen1	is 2 * rsiLen - 1.
   AvgU 	is ExpAvg(iff(U>0,U,0),rsiLen1).
   AvgD 	is ExpAvg(iff(D>=0,D,0),rsiLen1).
   rsi 	is 100-(100/(1+(AvgU/AvgD))).

! 350 SWING INDICATOR:
   rsiMA	is simpleavg(rsi,maLen).

! Simple system to test the rsiMA indicator:
   buy 	if rsiMA > upperLine.
   sell	if rsiMA < lowerLine.

! Rule for color study:
   Green 	if rsiMA > 50.
   Red 	if rsiMA < 50.

! Signal indicator (plot as single line indicator):
   rsiSignal  is iff(buy,1,iff(sell,-1,0)).
![]() TRADERSSTUDIO: 350 SWING INDICATOR
TRADERSSTUDIO: 350 SWING INDICATOR
The TradersStudio code for Barbara Star’s 350 swing indicator described in her article in this issue, “The 350 Swing Trade,” is given here.
The coded version that I am presenting here (Tfs, for “three fifty swing”) includes a system that can be used to test the indicator. The system uses only the author’s 350 swing indicator. To test the indicator in comparison to J. Welles Wilder’s original Rsi indicator, I devised a simple system based on the overbought and oversold levels suggested by Star. The rules for this system are as follows:
- Go long when the TFS is below the lower level (20).
- Exit long positions when the TFS is above the upper level (upperLine).
- Also exit long positions when max bars holding (maxHold) period has been reached.
- Go short when the TFS is above the upper level (80).
- Exit short positions when the TFS is below the lower level (lowerLine).
- Also exit short positions when the max bars (maxHold) holding period has been reached.
When the averaging parameter (smoLen) is set to 1, the system is using the standard Rsi but with the shorter three-bar length parameter. When the max bars held is set to a large number (1,000), the system no longer uses the max bars holding period as an exit and is thus always in the market.
To test the indicator, I used only S&P 500 pit-traded futures contacts with data supplied by Pinnacle Data Systems over the test period from 12/31/1988 to 12/8/2009. Since the Wilder Rsi is the same as the author’s Rsi with smoLen =1, to test whether the three-bar smoothing that the author added to the Wilder Rsi improved performance, I ran an optimization that included the one-bar parameter. We then compare the one-bar optimization to the optimizations using a smoothing parameter of 2 or greater. On the left side of Figure 7, I show a three-dimensional parameter map of net profit versus the smoLen and maxBars held.
We can see that the smoothing did not improve performance when the other parameters were set as shown, with the best performance occurring with a one-bar smoothing length and a 10-bar max holding period. After running this first optimization, I used the TradersStudio genetic optimizer on all parameters simultaneously and obtained the following as suggested best net profit parameters:
RSI length (rsiLen) 	        2
Smoothing length (smoLen)	1
Sell level (upperLine)	        70
Buy level (lowerLine)	        22
Maximum holding bars (maxHold)	7 or 1,000
I then ran an optimization on the rsiLen and smoLen using the other parameters from the genetic optimization. The result is shown in the three-dimensional parameter map on the right side of Figure 7. Here we can see that the rsiLen is the most critical parameter, as the net profit falls off rapidly as the length is increased from 2. In addition, we see that increasing the smoLen is not adding to the net profit.
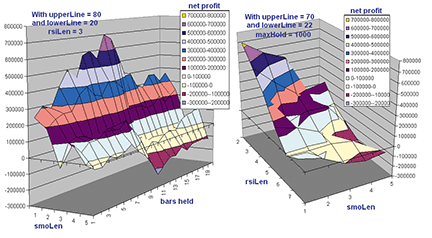
Figure 7: TRADERSSTUDIO, 350 SWING SYSTEM. Here are sample parameter maps for the 350 swing indicator (TFS) system trading the S&P contract. The superior performance of the one-bar smoothing length indicates that the TFS indicator did not improve the performance of this system on this market.
My conclusion from these tests is that as far as trading the S&P with this indicator is concerned, I would stick to the original Rsi but use a two-bar length. Due to time constraints, I did not run tests on other futures markets, which may show different results. When I tested a similar system on stocks, I did find that the smoothing on the Rsi showed significantly better results than using the original Rsi with a three-bar length.
The code can be downloaded from the TradersStudio website at www.TradersStudio.com→Traders Resources→FreeCode and also from www.TradersEdgeSystems.com/traderstips.htm.
![]() STRATASEARCH: 350 SWING INDICATOR
STRATASEARCH: 350 SWING INDICATOR
The idea of breaking from the traditional 14-day Rsi with its 80/20 crossover points is a good one. If fact, one of the prebuilt indicators that comes with StrataSearch allows users to test a variety of Rsi approaches using different lookback periods and crossover points. As author Barbara Star implies in her article in this issue, “The 350 Swing Trade,” different market conditions require different Rsi implementations, so testing a variety of parameters is a worthwhile idea.
Star doesn’t provide a specific trading system in her article, but she does provide both a primary and supporting indicator that can be used alongside other evaluation criteria. This works quite well in StrataSearch, since users are able to run automated searches for trading systems. Using the 350 swing trade formulas as a base, users can see which supporting indicators will work best alongside them.
During our testing of roughly 25,000 indicator combinations, we were able to find some systems based on the 350 swing trade that worked quite well, so this month’s tip is certainly a welcome addition.
As with all other Traders’ Tips, additional information, including plug-ins, can be found in the Shared Area of the StrataSearch user forum. This month’s plug-in provides a prebuilt chart, strategy, and trading rules for use in the automated search for winning systems.
A sample chart is shown in Figure 8.
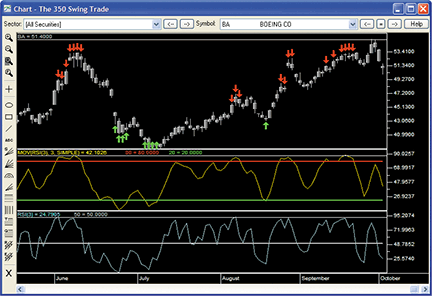
Figure 8: STRATASEARCH, 350 Swing Trade. The bottom panel shows the 350 swing indicator plotted as a line crossing above and below 50. The 350 swing alert can be seen as a crossover in the center panel, and as arrows in the top price panel.
//*********************************************************
// 350 Swing Indicator
//*********************************************************
Entry String:
CrossAbove(RSI(3), 50)

Exit String:
CrossBelow(RSI(3), 50)

//*********************************************************
// 350 Swing Alert
//*********************************************************
Entry String:
MOV(RSI(3), 3, simple) < 20

Exit String:
MOV(RSI(3), 3, simple) > 80
![]() TRADECISION: 350 SWING INDICATOR
TRADECISION: 350 SWING INDICATOR
The article by Barbara Star in this issue, “The 350 Swing Trade,” demonstrates how to decrease an indicator’s lookback period to increase its sensitivity to smaller price moves and identify the beginning and end of a short-term price swing.
Using Tradecision’s Indicator Builder, you can recreate the Rsi MA indicator:
RSI MA indicator:
in
 RSILength:"Enter the RSI Length:", 3;
 SMALength:"Enter the SMA Length:", 3;
end_in

return SMA(RSI(C,RSILength),SMALength);
Then you can recreate the 350 swing alert strategy using Tradecision’s Strategy Builder:
Entry long signal:
var
 SMALength:=3;
 RSILength:=3;
end_var

return SMA(RSI(C,RSILength),SMALength) <= 20;

Entry short signal:
var
 SMALength:=3;
 RSILength:=3;
end_var

return SMA(RSI(C,RSILength),SMALength) >= 80;
To import the strategy into Tradecision, visit the area “Traders’ Tips from Tasc Magazine” at www.tradecision.com/support/tasc_tips/tasc_traders_tips.htm or copy the code from the Stocks & Commodities website at www.traders.com.
A sample chart is shown in Figure 9.
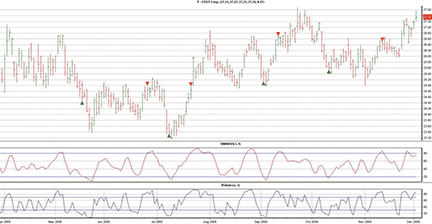
FIGURE 9: TRADECISION, 350 swing alert strategy. Here is a sample chart of AT&T with the RSI, the RSI_MA, and the swing trade strategy applied. The RSI_MA is in the bottom panel and the swing alerts are above and below the price bars. The RSI_MA provides cleaner reversal signals and eliminates some unproductive entries and exits. The swing alerts warn of a potential reversal.
![]() NINJATRADER: 350 SWING INDICATOR
NINJATRADER: 350 SWING INDICATOR
The 350 swing indicator as presented by Barbara Star in her article in this issue, “The 350 Swing Trade,” has been implemented as an indicator available for download at www.ninjatrader.com/SC/February2010SC.zip.
Once it has been downloaded, from within the NinjaTrader Control Center window, select the menu File→Utilities→Import NinjaScript and select the downloaded file. This indicator is for NinjaTrader version 6.5 or greater.
You can review the indicator’s source code by selecting the menu Tools→Edit NinjaScript→Indicator from within the NinjaTrader Control Center window and selecting “RSI_MA_350.”
NinjaScript indicators are compiled Dlls that run native, not interpreted, which provides you with the highest performance possible.
A sample chart implementing the strategy is in Figure 10.
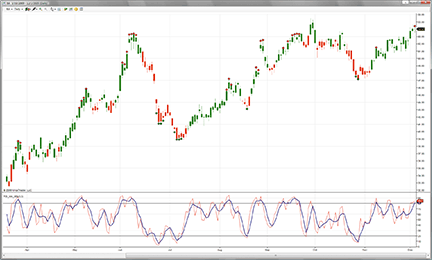
Figure 10: NINJATRADER, 350 SWING INDICATOR. This sample screenshot shows the 350 swing indicator applied to a daily chart of Boeing (BA).
![]() NEOTICKER: 350 SWING INDICATOR
NEOTICKER: 350 SWING INDICATOR
The 350 swing indicator presented in Barbara Star’s article in this issue, “The 350 Swing Trade,” can be implemented in NeoTicker by combining several built-in indicators and some single-line formulas.
The 350 swing indicator colors the price bars when the three-period Rsi is above or below 50. I use NeoTicker’s Highlight Bar Formula feature (Figure 11) to archive this task, which will paint bars with user-defined colors according to conditions entered in the parameter field.
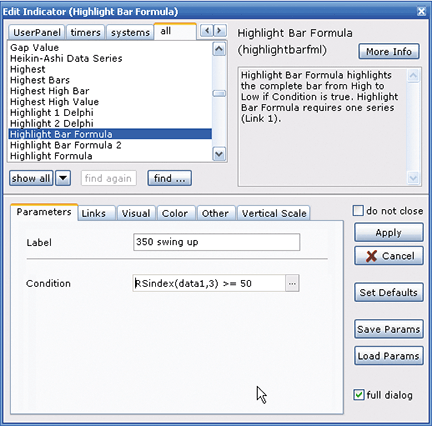
Figure 11: NEOTICKER, Highlight Bar Formula. The Highlight Bar Formula indicator in NeoTicker paints the bars with user-defined colors according to conditions entered in the parameter field.
To do this, first, add the Highlight Bar Formula onto a chart and enter the formula (Listing 1) to paint the bars green when the three-period Rsi is greater than or equal to 50. Add another Highlight Bar Formula and use another formula (Listing 2) to paint bars red when the three-period Rsi is less than 50.
Next, we can mark overbought and oversold price bars when the smoothed three-period Rsi exceeds the 80 and 20 levels. To do this, I use NeoTicker’s Highlight Formula feature (Figure 12), which is similar to the Highlight Bar Formula feature used above except it plots a dot at the price level specified by the user instead of painting an entire price bar. First, enter the formula code for the 350 swing alert overbought, which is a three-period smoothed 350 swing indicator above 80, in the Condition field. Then, in the Position field, set the plot to appear at the high plus 0.5 (Listing 3). (This number can be adjusted according to the underlying instrument.) Add another Highlight Formula indicator to mark occurrences of 350 swing oversold with the corresponding parameters (Listing 4).
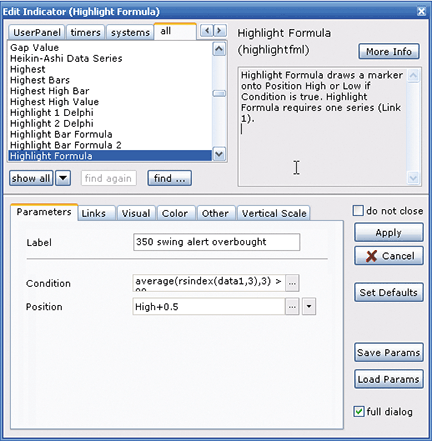
Figure 12: NEOTICKER, Highlight Formula. The Highlight Bar Formula indicator in NeoTicker plots a dot at the price level specified by the user. We can use this feature to mark overbought and oversold price bars.
This completes the highlighting of time chart bars according to the ideas presented in Star’s article. Next, add a standard Rsi indicator as “Rsi 3” in the lower pane (Figure 13). For Rsi MA 3, I use NeoTicker’s indicator-on-indicator ability that applies a simple moving average on Rsi 3 within the chart to show the smoothed Rsi plot in another pane.
For users interested in more detail or a chart group download, visit NeoTicker’s blog site (https://blog.neoticker.com).
Listing 1
RSIndex(data1, 3) >= 50

Listing 2
RSIndex(data1, 3) < 50

Listing 3
Condition: Average(RSIndex(data1,3),3) > 80
Position: High+0.5

Listing 4
Condition: Average(RSIndex(data1,3),3) < 20
Position: Low-0.5
A sample chart implementing the strategy is shown in Figure 13.
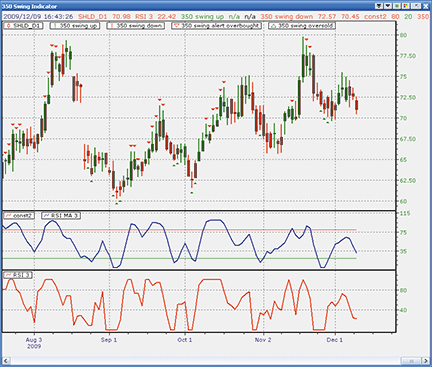
Figure 13: NEOTICKER, 350 SWING INDICATOR. Here is a sample implementation of the 350 swing indicator in NeoTicker. The 350 swing indicator colors the price bars when the three-period RSI is above or below 50. The standard RSI indicator is in the lower pane and the smoothed RSI plot is in the middle pane.
![]() WAVE59: 350 SWING INDICATOR
WAVE59: 350 SWING INDICATOR
In her article in this issue, “The 350 Swing Trade,” Barbara Star describes a 350 swing indicator, which is a smoothed three-period Rsi used more as a trend indicator than an overbought/oversold indicator.
Figure 14 is a weekly chart of the Dow Jones Industrial Average showing the 350 swing indicator in action. Just as Star describes, it picks up termination points in trends very quickly, needing only three bars after the March lows to identify the uptrend.
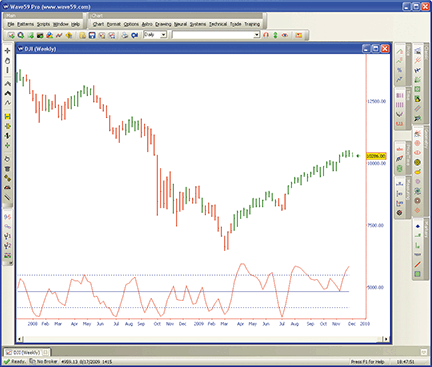
FIGURE 14: WAVE59, 350 SWING INDICATOR. The 350 swing indicator picks up termination points in trends very quickly, needing only three bars after the March lows to identify the uptrend.
The following script implements this indicator in Wave59. As always, users of Wave59 can download these scripts directly using the QScript Library found at https://www.wave59.com/library.
Indicator:  SC_Star_350
input:thickness(2),up_color(green),dn_color(red),rsi_color(red),zero_color(blue);

# calculate smoothed 3-period RSI
Rsi = rsi(close,3);
Avg = average(rsi,3);

# Plot everything
plot1 = avg;
color1 = rsi_color;
plot2 = 50;
plot3 = 80;
plot4 = 20;
color2, color3, color4 = zero_color;
style3, style4 = ps_dot;

# Plot Colorbars
if (avg > 50) colorbar(barnum, up_color, thickness);
if (avg < 50) colorbar(barnum, dn_color, thickness);
![]() INVESTOR/RT: 350 SWING INDICATOR
INVESTOR/RT: 350 SWING INDICATOR
Barbara Star’s 350 swing indicator can be implemented relatively easily in Investor/RT, as seen in Figure 15. The candles are painted red or green using a Paint Bar indicator that in turn is based on a custom indicator with a syntax of simply “Rsi.” The Paint Bar indicator is set up to paint bars green when the Rsi is above 50 and red when the Rsi is below 50. The diamond signal markers above and below the bars use the basic syntax of:
RSI > 80
for the red diamonds above the bars, and
RSI < 20
for the green diamonds below the bars.
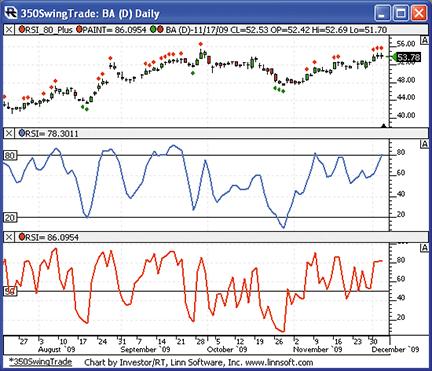
FIGURE 15: INVESTOR/RT, 350 SWING INDICATOR. A three-period RSI is plotted in red in the lower pane, while a smoothed (3) RSI is plotted in the middle pane. The candles are painted red when the RSI is below 50 and green when it is above 50. Red diamonds are drawn above the bars when the smoothed(3) RSI is below 20, and green diamonds are drawn below the bars when it’s above 80.
The middle pane paints the smoothed(3) three-period Rsi in blue while the lower pane paints the three-period Rsi in red.
To import a chart containing the 350 swing indicator into Investor/RT, visit https://www.linnsoft.com/charts/350SwingTrade.html.
If you would like to learn more about creating custom indicators in Investor/RT, visit https://www.linnsoft.com/tutorials/rtl.htm.
![]() TRADE NAVIGATOR: 350 SWING INDICATOR
TRADE NAVIGATOR: 350 SWING INDICATOR
Trade Navigator offers everything needed for recreating the highlight bars and indicators presented by Barbara Star in her article in this issue, “The 350 Swing Trade.”
Here we will show you how to recreate the custom highlight bars and indicators using the following TradeSense code, then add them to any chart in Trade Navigator.
First, open the Trader’s Toolbox, click on the Functions tab and click the New button. Enter the description “BarColorUp 350.” Then enter the following formula:
RSI (Close , 3 , False) > 50
Click the Verify button. Click the Save button, type a name for your new function and click OK.
Repeat these steps for the BarColorDown 350, TagUp, TagDown, and Rsi Ma functions using the following formulas for each:
BarColorDown 350
RSI (Close , 3 , False) < 20

TagUp
MovingAvg (RSI (Close , 3 , False) , 3) < 20

TagDown
MovingAvg (RSI (Close , 3 , False) , 3) > 80

RSI Ma
MovingAvg (RSI (Close , 3 , False) , 3)
To create a chart, go to the “Add to chart” window by clicking on the chart and typing “A” on the keyboard.
Click on the HighlightBars tab, find the BarColorUp 350 highlight bar in the list, and either double-click on it or highlight the name and click the “Add” button. Repeat these steps to add BarColorDown 350, TagUp, and TagDown.
Next, click on the Indicators tab, find the Rsi Ma indicator in the list and either double-click on it or highlight the name and click the “Add” button. Repeat these steps to add the Rsi. Rsi already exists in Trade Navigator as a predefined function.
Click on the chart and type the letter “E.” Highlight each highlight bar/marker or indicator and change it to the desired color in the chart settings window. When you have them the way you want to see them, click OK.
You can save your new chart as a template to use for other charts. Once you have the chart set up, go to the Charts dropdown menu, select “Templates” and then “Manage chart templates.” Click on the New button, type in a name for your new template, and click OK.
Genesis Financial Technologies has provided a library called “350 Swing Trade” that includes a template with the custom highlight bars and indicators as a special file named “SC1002,” downloadable through Trade Navigator.
![]() UPDATA: 350 SWING INDICATOR
UPDATA: 350 SWING INDICATOR
This tip is based on Barbara Star’s article in this issue, “The 350 Swing Trade.” In it, Star proposes a highly visual tool to help identify the beginning and end of a price swing. This tools uses a combination of displays — in this case, a three-period Rsi, Donchian channels, and color-coded bars. All parameters are fully customizable with the Updata code shown here.
The Updata code for Star’s indicator is already in the Updata Indicator Library and may be downloaded by clicking the Custom menu and then Indicator Library. Those who cannot access the library due to firewall issues may paste the following code into the Updata Custom editor and save it.
NAME 350 SWING INDICATOR
NAME8 RSI_SMA [3,3]
PARAMETER "RSI PERIOD" #PERIOD=3
PARAMETER "DONCHIAN LENGTH" #LENGTH=13

DISPLAYSTYLE 8LINES
PLOTSTYLE CANDLE
INDICATORTYPE TOOL
INDICATORTYPE8 CHART
COLOUR5 RGB(0,0,255)
COLOUR6 RGB(0,0,255)
COLOUR7 RGB(255,0,0)

@RSI=0
@RSIsma=0
@UPPER=0
@LOWER=0
@MID=0

FOR #CURDATE=#LENGTH TO #LASTDATE

   @PLOTOPEN=OPEN
   @PLOT=CLOSE
   @PLOTHIGH=HIGH
   @PLOTLOW=LOW
   @UPPER=PHIGH(HIGH,#LENGTH)
   @LOWER=PLOW(LOW,#LENGTH)
   @MID=(@UPPER+@LOWER)/2
   @RSI=RSI(#PERIOD)
   @RSIsma=SGNL(@RSI,3,M)

   IF @RSI>50
    Colour RGB(0,230,0)
   ELSE
    Colour RGB(230,0,0)
   ENDIF
   @PLOT5=@UPPER
   @PLOT6=@LOWER
   @PLOT7=@MID
   @PLOT8=SGNL(@RSI,3,M)

NEXT
A sample chart is shown in Figure 16.
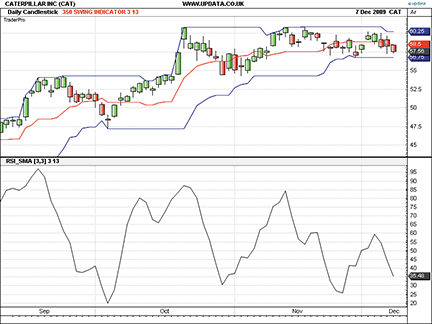
FIGURE 16: UPDATA, 350 SWING INDICATOR. This sample chart shows a three-period simple moving average of a three-period RSI, together with Donchian channels.
![]() ENSIGN WINDOWS: 350 SWING INDICATOR
ENSIGN WINDOWS: 350 SWING INDICATOR
This implementation of Barbara Star’s 350 swing indicator in Ensign Windows does not require any code to color the chart bars. Instead, the flexibility built into every study is utilized to color the chart bars via Ensign Window’s color bar marker.
An Rsi study has been added to the chart and its property form has been configured as shown in Figure 17. The key to Ensign’s solution is the “Zones study mode” selection, which displays multiple rows for each study line. In the top section showing the Rsi line, the top row is what will display when the Rsi line value is above 50.00. The line color is the leftmost red color square. The marker selection is Ensign’s color bar marker, which uses the rightmost green color square to color the chart bars.
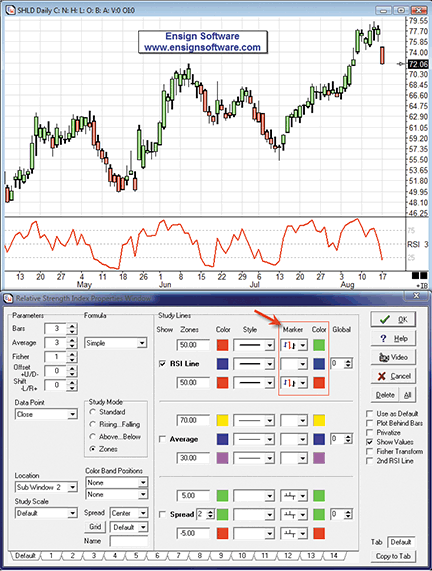
FIGURE 17: ENSIGN WINDOWS, RSI Property Form
The third row of the top section is what will display when the Rsi line is below 50.00. The line color is red, and the color bar marker color is also red. As shown in the sample chart for Shld, the bars have been colored green or red based on the Rsi value.
Ensign Windows also has Bollinger bands, Donchian channels, average true range, study alerts, and the ability to implement the swing trading ideas featured in Star’s article.
![]() TRADE IDEAS: 350 SWING INDICATOR
TRADE IDEAS: 350 SWING INDICATOR
In her article in this issue, “The 350 Swing Trade,” Barbara Star identifies the importance of deploying the right kind of trading strategy when the market enters periods of extended volatility. Astute traders with the tools to know what is or is not unusual are able to climb aboard robust price movement and profit until the momentum diminishes.
Our model this month spots opportunities in the direction of strength using the daily Rsi value of stocks. Here is a strategy that finds stocks with a strong Rsi above 80 and goes long using a dollar profit target and stop. The results yield a 77% success rate.
Description:  “RSI Swing”
Provided by: Trade Ideas (copyright © Trade Ideas LLC 2010). All rights reserved.
For educational purposes only.  Remember these are sketches meant to give an idea
how to model a trading plan. Trade-Ideas.com and all individuals affiliated with
this site assume no responsibilities for trading and investment results.
Type or copy/paste this shortened string directly into a browser then copy/paste the full-length link into Trade-Ideas Pro using the “Collaborate” feature (right-click in any strategy window):
https://bit.ly/7sQdtH (case-sensitive)
This strategy also appears on the Trade Ideas blog at https://marketmovers.blogspot.com/.
Figure 18 shows the configuration of this strategy, where one alert and five filters are used with the following settings:
- New high alert (filter = 30 day highs)
- Min price = 5 ($)
- Max price = 150 ($)
- Max distance from inside market = 0.01 (%)
- Min daily Vvolume = 50,000 (shares/day)
- Min daily RSI = 85
The definitions of these indicators appear at https://www.trade-ideas.com/Help.html.
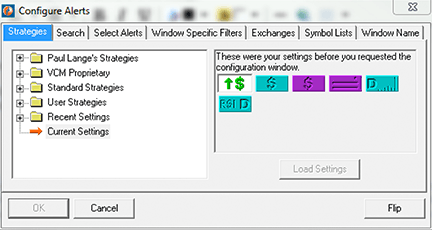
FIGURE 18: TRADE IDEAS, alerts configuration.
That’s the strategy, but what about the trading rules? How should the opportunities that the strategy finds be traded?
To recap briefly, The OddsMaker doesn’t just look at a basket of stocks, à priori, to generate backtest results. Rather, it considers any stock that matches a desired pattern in the market, finds that stock, and applies the backtest’s ruleset before summing up the results into a detailed set of totals: win rate, average winner, average loser, net winnings, confidence factor.
In summary, this strategy skips the calamity of the first 30 minutes after the open. In the absence of real news, many swing traders consider the true direction of the market to take hold after this period of jockeying for position. Afterwards, it trades for the rest of the session, going long when triggered by the new 30-day high alert. We evaluated several time frames, but were ultimately led to a hold time until the open five days after entering the trade with a $1 profit target and stop-loss. Note the average losing trade for this strategy is $0.92.
Here is what The OddsMaker tested for the past 30 days ended 11/30/2009 given the following trade rules:
- On each alert, buy the symbol (price moves up to be a successful trade)
- Schedule an exit for the stocks at the open five days after entry
- Trade the entire market session after the first 30 minutes
- Consider exiting the trade (sell) if the price moves down $1 or if a profit target of $1 is reached.
The OddsMaker summary provides the evidence of how well this strategy and our trading rules did. The settings are shown in Figure 19. The results are shown in Figure 20.
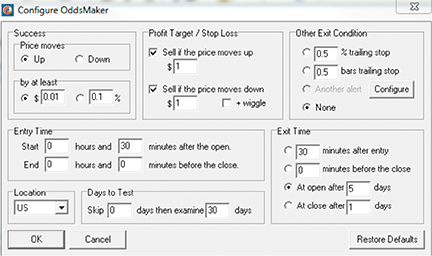
FIGURE 19: TRADE IDEAS, oddsmaker backtesting configuration.
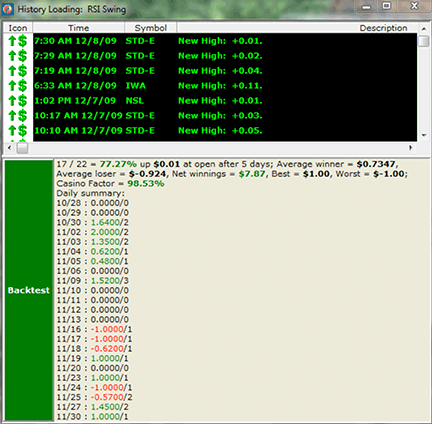
FIGURE 20: TRADE IDEAS, backtest results.
The summary reads as follows: This strategy generated 22 trades of which 17 were profitable for a win rate of 77%. This high win rate forgives the following: an average winning trade of $0.73 in profit and the average losing trade of $0.92. The net winnings of using this strategy for 30 trading days generated $7.87 points. If you normally trade in 100-share lots, this strategy would have generated $787. The z-score or confidence factor that the next set of results will fall within this strategy’s average winner and loser is 99%.
You could tweak this strategy to account for the ideal width of the price channels discussed in Star’s article by selecting the average true range filter within Trade-Ideas Pro and setting its filter value to $10.
You can learn more about interpreting these backtest results from The OddsMaker at https://www.trade-ideas.com/OddsMaker/Help.html.
![]() eSIGNAL: 350 SWING INDICATOR — ARTICLE CODE
eSIGNAL: 350 SWING INDICATOR — ARTICLE CODE
Code in eSignal’s Eds language for Barbara Star’s 350 swing indicator and related techniques from her article in this issue, “The 350 Swing Trade.”
RSI 3
var xRSI = null;
var bInit = false;
var bCharts = false;

function preMain() {
	setStudyTitle("RSI 3");
	setShowCursorLabel(true);
	setShowTitleParameters(true);
	setPriceStudy(false);

  setStudyMin(0);
  setStudyMax(100);

	setCursorLabelName("RSI 3", 0);
	setDefaultBarFgColor(Color.red, 0);
	setPlotType(PLOTTYPE_LINE, 0);
	setDefaultBarThickness(2, 0);

	var fp1 = new FunctionParameter("nLength", FunctionParameter.NUMBER);
	fp1.setName("RSI Length");
	fp1.setDefault(3);

}
function main(nLength) {
	if (!bInit) {
		xRSI = rsi(nLength);
    addBand(25, PS_SOLID, 1, Color.grey, "25");
    drawTextAbsolute(-2,28,"25",Color.black,null,null,"Arial",10,"T25");

    addBand(50, PS_SOLID, 1, Color.black, "50");
    drawTextAbsolute(-2,53,"50",Color.black,null,null,"Arial",10,"T50");

    addBand(80, PS_SOLID, 1, Color.grey, "80");
    drawTextAbsolute(-2,83,"80",Color.black,null,null,"Arial",10,"T80");
		bInit = true;
	}

	var nRSI = xRSI.getValue(0);
	if (nRSI == null) return;

	return nRSI;

}


350 SWING INDICATOR
debugClear();
var bNewBar = false;
var bAlert = false;
var xRSI = null;
var bInit = false;

function preMain() {
	setStudyTitle("350 Swing Indicator");
	setPriceStudy(true);
	setColorPriceBars(true);
	setDefaultPriceBarColor(Color.black);

	setShowCursorLabel(false);

	var fp1 = new FunctionParameter("nRSILength", FunctionParameter.NUMBER);
	fp1.setName("RSI Length");
	fp1.setDefault(3);

	var fp2 = new FunctionParameter("cUpColor", FunctionParameter.COLOR);
	fp2.setName("Bar Color UP");
	fp2.setDefault(Color.green);

	var fp3 = new FunctionParameter("cDownColor", FunctionParameter.COLOR);
	fp3.setName("Bar Color DOWN");
	fp3.setDefault(Color.red);


}
function main(nRSILength, cUpColor, cDownColor) {

	if (!bInit) {
		xRSI = rsi(nRSILength);
		bInit = true;
	}

	var nRSI = xRSI.getValue(0);
	if (nRSI == null) return;


	if (nRSI > 50)
    setPriceBarColor(cUpColor);
	else if (nRSI < 50)
    setPriceBarColor(cDownColor);
	else
    setPriceBarColor(Color.black);

}


RSI MA

var xRSI = null;
var xMA = null;
var bInit = false;

function preMain() {

	setStudyTitle("RSI MA");
	setShowTitleParameters(true);

	setStudyMin(0);
	setStudyMax(100);

	setCursorLabelName("RSI MA", 0);
	setDefaultBarFgColor(Color.darkgrey, 0);
	setPlotType(PLOTTYPE_LINE, 0);
	setDefaultBarThickness(2, 0);

	var fp1 = new FunctionParameter("nRSILength", FunctionParameter.NUMBER);
	fp1.setName("RSI Length");
	fp1.setDefault(3);

	var fp2 = new FunctionParameter("nMALength", FunctionParameter.NUMBER);
	fp2.setName("MA Length");
	fp2.setDefault(3);
}
function main(nRSILength, nMALength) {
	if (!bInit) {
		xRSI = rsi(nRSILength);
		xMA = sma(nMALength, xRSI);

    addBand(20, PS_SOLID, 1, Color.grey, "20");
    drawTextAbsolute(-2,23,"20",Color.black,null,null,"Arial",10,"20");

    addBand(80, PS_SOLID, 1, Color.grey, "80");
    drawTextAbsolute(-2,83,"80",Color.black,null,null,"Arial",10,"80");

		bInit = true;
	}

	var nMA = xMA.getValue(0);
	if (nMA == null) return;

	return nMA;

}


350 SWING ALERT
debugClear();
var bNewBar = false;
var bAlert = false;
var xRSI = null;
var xRT = null;
var bInit = false;

function preMain() {
	setStudyTitle("350 Swing Alert");
	setPriceStudy(true);

	setDefaultPriceBarColor(Color.black);

	setShowCursorLabel(false);

	var fp1 = new FunctionParameter("nRSILength", FunctionParameter.NUMBER);
	fp1.setName("RSI Length");
	fp1.setDefault(3);

	var fp2 = new FunctionParameter("nMALength", FunctionParameter.NUMBER);
	fp2.setName("MA Length");
	fp2.setDefault(3);

	var fp3 = new FunctionParameter("cUpColor", FunctionParameter.COLOR);
	fp3.setName("Signal Color UP");
	fp3.setDefault(Color.green);

	var fp4 = new FunctionParameter("cDownColor", FunctionParameter.COLOR);
	fp4.setName("Signal Color DOWN");
	fp4.setDefault(Color.red);

	var fp5 = new FunctionParameter("SignalSize", FunctionParameter.NUMBER);
	fp5.setName("Diamond Size");
	fp5.setDefault(10);
}
function main(nRSILength, nMALength, cUpColor, cDownColor, SignalSize) {

var ci = getCurrentBarIndex();

	if (!bInit) {
		xRSI = rsi(nRSILength);
		xMA = sma(nMALength, xRSI);
		xRT= rawtime();
		bInit = true;
	}

	var nMA = xMA.getValue(0);
	if (nMA == null) return;

	var nRT = xRT.getValue(0);

	if (nMA >= 80)
    drawTextRelative (0, AboveBar2, "\u0075", cDownColor, null, Text.PRESET | Text.CENTER | Text.ONTOP, "Wingdings",SignalSize , "tagDown" + nRT );
	else
    removeText("tagDown" + nRT);

  if (nMA <= 20)
    drawTextRelative (0, BelowBar2, "\u0075", cUpColor, null , Text.PRESET | Text.CENTER | Text.ONTOP, "Wingdings",SignalSize , "tagUp" + nRT);
  else
    removeText("tagUp" + nRT);

}