TRADING SYSTEMS
Cycle Vs. Trend Mode Detection
Empirical Mode Decomposition
Is the market trending or is it in a cycle mode? Identify the mode of the market and trade accordingly.
Even the most casual chart reader will be able to spot the times when the market is cycling and other times when longer-term trends are in play. Cycling markets are ideal for swing trading. However, attempting to trade the swing in a trending market can be a recipe for disaster. Similarly, applying trend trading techniques during a cycling market can equally wreak havoc in your account. Cycle or trend modes can be identified in hindsight. But it would be useful to have an objective scientific approach to guide you to the current market mode.
A number of tools are already available to differentiate between cycle and trend modes; measuring the trend slope over the cycle period to the amplitude of the cyclic swing is one possibility. However, this article describes a unique approach to determining the market mode.
Cycle mode
We begin by thinking of cycle mode in terms of frequency or its inverse, periodicity. The markets are fractal, so daily, weekly, and intraday charts are indistinguishable when time scales are removed. Thus, it is useful to think of the cycle period in terms of its bar count. For example, a 20-bar cycle using daily data corresponds to a cycle period of approximately one month.
When viewed as a wave form, slow-varying price trends constitute the wave form’s low-frequency components and day-to-day fluctuations (noise) constitute the high-frequency components. The objective in cycle mode is to filter out the unwanted components — both low-frequency trends and the high-frequency noise — and retain only the range of frequencies over the desired swing period.
A filter for doing this is called a bandpass filter and the range of frequencies passed is the filter’s bandwidth.

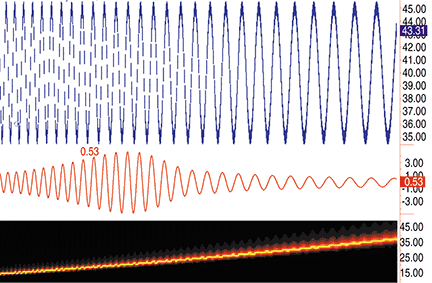
Figure 1: BANDPASS FILTER. A chirp wave form demonstrates the selectivity of the bandpass filter. The data is an idealized sine wave whose frequency varies continuously from high to low. The bottom subgraph shows the measured cycle period. The subgraph immediately below the input data is the bandpass-filtered output.