TRADING SYSTEMS
Developments & Improvements
My Trading Strategy, Revised
Here’s a methodology for developing and testing a rules-based system, improved from the original.
Since my article in the June 2009 issue of Stocks & Commodities, I have worked on some improvements for my strategy. This time, I outline a rough methodology that I will use going forward in my development and testing of rules-based systems. I have not created anything new here. I have simply pulled together bits and pieces of good ideas and techniques that are already out there and, I hope, summarized them in an organized and clear way. To remind readers, the starting point is to have selected what securities to trade (in my case, Spy, Ief, Iwm, and Ewz, to cite a few), what periodicity (daily), and what system (trading rules and range of parameters).
Given that, the system-testing methodology involves the following steps:
- Selecting the testing periods and determining the split between in- and out-of-sample data
- Optimizing system on in-sample data and selecting the “best” combination of parameters
- Building an out-of-sample equity curve (“walkforward” backtesting)
- Assessing probable equity curve scenarios six months forward via Monte Carlo simulation on out-of-sample equity curve
- Repeating steps 2 through 4 in six months.
My guiding principles are: use data in the most representative way possible, keep trading rules as simple as possible, combat curve-fitting, and estimate future system performance (with a high degree of confidence).
Before we move forward, let’s check on the performance of the J2L System with long-term trend filter and dynamic position sizing as described in my June 2009 article.
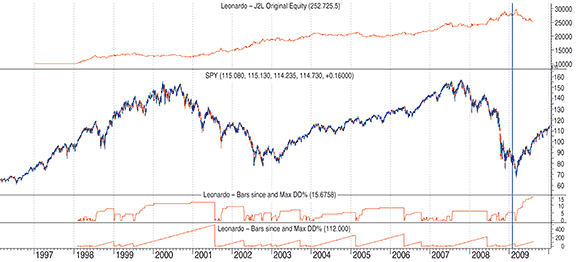
Figure 1: OLD SYSTEM EQUITY CURVE. The equity grew from about $270,000 to $300,000 during February 2009 just to come crashing down back to around $250,000 on 8/17/09. This system is in the midst of its largest drawdown since January 1997, at around 16% (second pane from bottom in Figure 1). The bottom pane shows the number of bars between new equity peaks. This system clearly does better in a downtrending SPY.