CHARTING
Finding Those Entry And Exit Points
Intraday Short-Term Trading Tactics
Enter and exit trades the right way based on familiar chart patterns.
Swing trading prospects occur when price patterns form. Even though traders might be familiar with many chart patterns, they may not know how to enter and exit trades correctly based on those price patterns. Our purpose here is to discover short-term trading strategies that will help fine-tune entry and exit points while properly assessing stops. I’ll illustrate some attractive setups using the hourly chart of the ProShares UltraShort for the Standard & Poor’s 500 (Sds).
The ProShares Ultra Short for the S&P 500 (Sds) is one way to short the S&P 500 using leverage. It moves twice the inverse of the S&P 500. If you wanted to short the S&P 500, you would go long Sds.
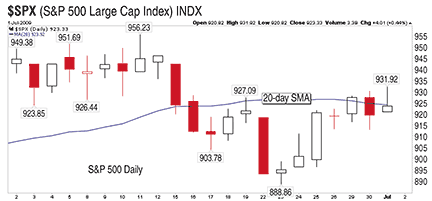
Ideally, you want to be long Sds (short the S&P 500) when the S&P 500 is below its 20-day simple moving average in the daily time frame, as is in Figure 1. Doing so will increase your odds for a successful trade.

Figure 1: $sPX, daily. After the S&P 500 broke below the 20-day simple moving average (SMA) in mid-June, prices immediately rose back up to test it. After the rally failed, another attempt was made in late June. The last candle in June is a shooting star, with a small body at the bottom of the candle and a long upper shadow.
Steps to take before trading
So let’s review the hourly chart to see what the prospects are before deciding to take a trade. Figure 2 shows that in mid-June the hourly chart of Sds had been in a rising channel for almost two weeks when a bearish descending triangle pattern appeared on June 23. A bearish divergence loomed over the hourly, increasing its negative influence over the descending triangle pattern. The following session, prices gapped lower, collapsing through the triangle as they tested the lower boundary of the rising channel. This move was accompanied by a bearish crossover of the moving average convergence/divergence (Macd) (12, 26, 9).