INDICATORS
Identifying Entries And Exits
Smoothing The Bollinger %b
This variation of the popular Bollinger %b indicator gives clear turning points that will help traders identify entry and exit points while prices are moving between the Bollinger bands.
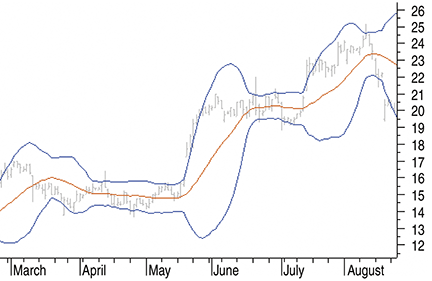
By now, everybody in the business knows that Bollinger bands were developed by John Bollinger. What they actually are is probably equally known. The Bollinger bands in Figure 1 consist of a set of three curves drawn in relation to price data. The middle band is usually a simple 20-bar moving average that serves as the base for the upper and lower bands.
Upper band = Middle band + 2 x 20-period closing prices standard deviation
Lower band = Middle band − 2 x 20-period closing prices standard deviation
Most technical analysis programs have a built-in function for displaying Bollinger bands. Here is the MetaStock formula for Bollinger bands using basic functions:
{The middle band}
Mov(Close,20,Simple);

{The upper band}
2*Stdev(Close,20 ) + Mov(Close,20,Simple);

{The lower band}
Mov(Close,20,Simple)-2*Stdev(Close,20)
In a normal distribution, most prices of a set of data are close to the average, with relatively few prices moving in one extreme or the other. If you were to look at a normally distributed data on a graph, it would look like a bell curve. Not all price data will reflect a perfect curve, of course. The standard deviation of the 20-period closing prices is a statistic that tells you how tight the price data are clustered around the mean.
The standard deviation of the moving average is a method used to measure price volatility. With trending prices, the bands will be wider as a result of the higher volatility in price, moving farther away from the mean, whereas during consolidation periods, bands tend to be narrower as a result of smaller price moves closer to the mean. This changing bandwidth is used for volatility-based trading opportunities.
%b is a measure of where prices are in relation to the outer Bollinger bands and therefore strongly related to volatility. %b was created as an oscillator to show overbought and oversold situations when price is moving close to or beyond the upper or lower Bollinger bands.

Figure 1: BOLLINGER BANDS. Bollinger bands consist of three curves drawn in relation to price data. The middle band is usually a 20-bar simple moving average that serves as the base for the upper and lower bands.