TRADING TECHNIQUES
Applying Momentum And Oscillators
Signal Processing Basics
Part 3
Part 1 of this series described a price model for stocks and discussed cycle analysis methods. Part 2 covered trends and smoothing methods with an emphasis on moving averages — one of the core tools of technical analysis. The third part of this series addresses momentum and oscillators and describes how the tools may be applied to trading systems.
Tools such as the fast Fourier transform (Fft) can be used to determine the cycles present in historical data. While not useful as a reliable predictor of stock prices, this knowledge can be used to tune other indicators and suggest the appropriate trading strategy. Trends and smoothing methods enable the trader to further determine market direction and establish a trading strategy. The missing piece provided here is the toolkit to time the best entry and exit points consistent with the chosen strategy.
Turning points
Much as we would like to look at a chart and go back to the previous low to make a buy, we have to make buy/sell decisions in real time. Trend-based systems using indicators such as moving average crossovers, which by definition are lagging indicators, can sacrifice profit potential at both ends of the trade and even produce losses in certain types of markets. What the trader needs is a method to identify turning price points with a good probability of being profitable.
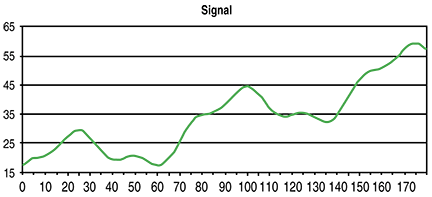
Let’s look at a simple example of the price model we are using in this series:
   Equation 3-1:
 P = c + b * t + m * sin(w1t) + n * cos(w2t)

Figure 1: identifying local turning points. The objective is to find a method to the local peaks and troughs in the signal as they occur.