INDICATORS
The Mystical, Mathematical MIDAS
An Anchored Vwap Channel
For Congested Markets
This indicator combines channel and envelope methodologies to accurately identify price reversals.
Physicist Paul Levine based his Midas (market interpretation/data analysis system) approach to technical analysis on a mathematical modification of the volume weighted average price (Vwap). Behind this modification is a well-thought-out philosophy of what drives market prices. This philosophy can be reduced to five basic tenets:
- The underlying order of price behavior is a fractal hierarchy of support and resistance levels.
- This interplay between support and resistance is a coaction between accumulation and distribution.
- This coaction, when considered quantitatively from raw price and volume data, reveals a mathematical symmetry between support and resistance.
- This mathematical symmetry can be used to predict market tops and bottoms in advance.
- Price and volume data — the volume weighted average price — subsequent to a reversal in trend, and thus to a major change in market (trader) sentiment, is key to this process of chart prediction.
The problem
While there is no obvious flaw in the logic that binds these five principles, there is one weakness in the final tenet involving what follows the end of a trend and a significant change in market sentiment. In his lectures, Levine repeatedly identified the ends of trends with significant trend reversals. Yet this need not be the case; the end of a trend will more likely herald a resting phase in market activity.

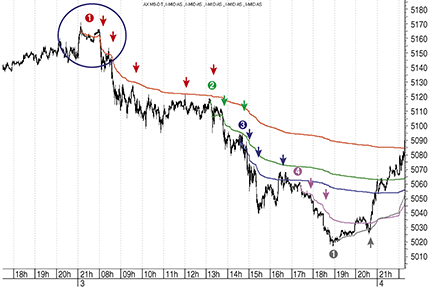
Figure 1: ONE-MINUTE chart of xetra DAX June 2009 futures. The circled area is a paradigm instance of where the end of a trend equals the start of a new one. The subsequent downtrend sustains four Midas resistance curves before terminating and heralding once again a trend change. This is marked by the launch of the first support curve at the gray (1).