charting
Still Useful After All These Years
Projecting Price And Time
With Gann Fans And Angles
Is it new? No, but Gann theory can still be implemented in the modern financial markets.
According to W.D. Gann, past time and price cycles will influence future price and time cycles and tell us the time and price at which future cycles are most likely to terminate. This theory sounds complicated, but it led the famous trader to the Gann fan, the angle of which could be used to project future price and time terminations. Here’s how.
Geometric angles
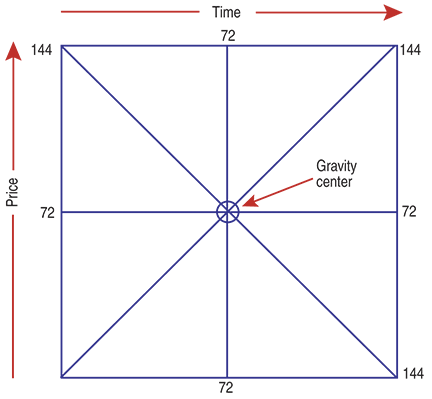
Geometric angles are used to measure the relationship between time, price, and space. The angles divide price and time into proportional parts. Gann angle lines are drawn from specific important points on any of the short-, medium-, or long-term charts. They are drawn at a specific angle that represents the relationship of time and price. In effect, the geometric angle is a moving average line that moves up and down a chart at a uniform rate of change. The difference between a standard moving average and a Gann geometric angle is that Gann angle lines may be used to project future time/price relationships.

Figure 1: DERIVING THE GEOMETRIC ANGLES. There are three types of angles: the vertical (90 degrees), the horizontal (zero degrees), and the diagonal, which can be anything between zero and 90 degrees.