charting
Which Way Will The Market Go? Find Out Here
Measuring The Markets With Pivots
Price action across all financial markets adheres to repeated patterns and reacts to evolving price levels through any given period of time. Using dynamic pivots is one way to measure price action in any market.
A critical piece of the trading puzzle is determining which way price trend will go. Stating the obvious? Well, yes and no. Trend is a highly relevant term, pertaining to the timeline of a trade’s expected hold time on a clock and/or distance on a chart. Do we intend to exit quickly or intraday for relatively small to modest gains? Hold through market noise for bigger gains? Overnight or beyond several sessions for trend trade gains? By definition, an uptrend for one relative time frame can be a downtrend for smaller or larger time frames.
You can measure price action in many different ways. Moving averages, trendlines, and basic floor trader pivots are some of many popular chart tools for determining price direction or trend. Floor trader pivots are calculated based on the average of the high, low, and close of the previous trading day. They tend to be static.
Dynamic pivots
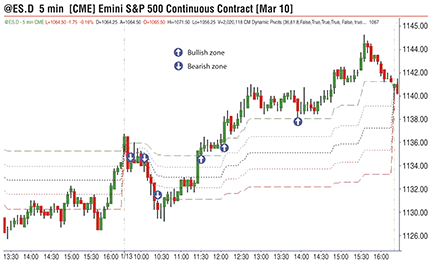
Another chart tool many traders aren’t familiar with is what I refer to as dynamic pivots. The dynamic pivots price study measures any time period’s range from its low to its high (zero percent to 100%). Price measurement values are plotted at 25%, 50%, and 75% retracement levels from low (zero) to high (100) peaks of the range. You could also add midlevel marks at 38% and 62% as important Fibonacci values. These overall price tool values could be Fibonacci based or fractional numbers based. In other words, using 0-25-33-50-66-75-100 or 0-23-38-50-62-78-100 doesn’t seem to make much (if any) difference over a long period of time.

Figure 1: bullish and bearish zones. A rule of thumb is to open long positions when price is above the 75% level and to open short positions when price is below the 25% level.