FOREX FOCUS
Metals Market Mashup
Trading Forex Gold And Silver
Daytrade and position trade forex gold and silver using intraday candlestick patterns.
There is a fundamental difference in the way market technicians using candlesticks look at price data and movement compared to their line- and bar-charting counterparts. Line- and bar-charting traders emphasize a close-to-close relationship of market price. When they say that the Dow Jones Industrial Average (Djia) closed up or down 100 points, they are comparing the closing price over the last two sessions. When those traders describe price movement, they are speaking of the change from session to session. They view that price change as a critical factor for gaining insight.
One type of chart that uses closing prices only is the line chart, which is created by connecting a series of datapoints with a line. The points we use are the closing prices. From this the trader moves to a bar chart, which plots the open, low, high, and close as a single line. The candlestick chart uses the same four price points but plots the information differently.
For the technician using candlesticks, the most important factor is the relationship between the opening and closing price of a session: Price change is most highly valued for market insight. When looking at market sentiment, it is the outcome of the battle between the buyers and sellers, those who think the price is overvalued and those who think the price is undervalued. This factor is the basis behind candlestick charts and their patterns. That is why there are so many types of single candles, each one telling a different aspect of the battle just waged.

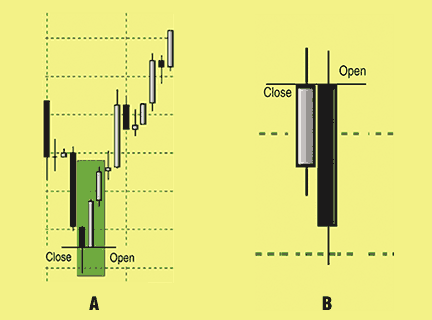
Figure 1A: Engulfing bullish pattern. This pattern occurs in a downtrend. The body of the black candle is engulfed by the following white candle body.
Figure 1B: engulfing bearish pattern. The close of the white candle is equal to the open of the following black candle.