Websites For Traders
www.DailyFX.com
DailyFX.com, a part of Fxcm.com, provides news and analysis of the foreign exchange markets, updated during the trading day. A quick glance at the tabs toward the top of the home page gives you a good idea of the features available on the website.
Recently, Fxcm launched the DailyFX Trading Course, designed to educate forex traders via video-based tutorials. This course is available free to all Fxcm clients. The course can be accessed via the DailyFX website. You do need a username and password to gain access to the course as well as some other features, to be discussed here.
Trading signals
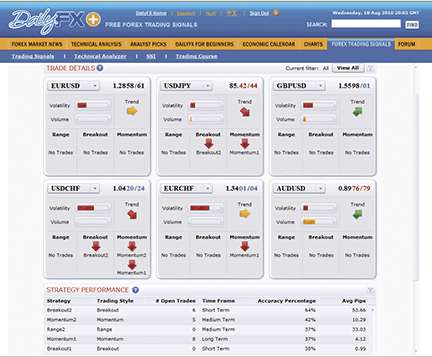
Once you are logged in, the trading signals page, which is under the forex trading signals tab, will open up by default (Figure 1). The trading signals page displays alerts, trade details, and strategy performance information. You have the option of filtering alerts based on strategies, currency pairs, and time frames. The strategies include breakout, range, and momentum. There are various currency pairs you can select using the dropdown menu, and your choices for time frames are short, medium, and long term.

Figure 1: trading signals. Here you see a display of alerts, trade details, and strategy performance. You have the option of filtering them using the dropdown menus available to you.
The trade details window displays information about all open trade signals. This window displays the action to take (“Enter now or hold”); the signal (currency pair followed by buy or sell signal entry price); strategy (breakout, momentum, or range); stops (suggested price to place stop-loss); limits (suggested price to place limit order); and P/L (profit/loss in pips). Sometimes you may see an alert that says “Trade near.” This is a useful feature, since it is an early warning signal that a trade could be triggered very soon — all the more reason to keep a close watch on the pair with the trade-near alert. Below the alerts table is a visual display of up to six currency pairs. You can select which pairs to display using a dropdown menu.
The strategy performance window displays the statistics for each of the trading strategies. This includes the number of trades, time frame, accuracy percentage, and the number of pips returned per trade over the past two months. To apply any of these listed strategies, just click on the row and the results will be displayed in the trade details window.
Technical analyzer
In addition to receiving trading signals under the forex trading signals tab, you have the technical analyzer, the speculative sentiment index (Ssi), and the trading course. The technical analyzer is where you will find analysis for the euro (Eur), the yen (Jpy), the British pound (Gbp), and the Swiss franc (Chf).
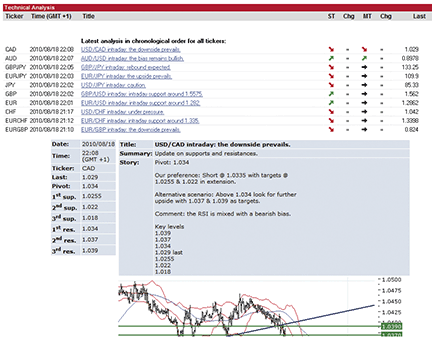
Given that currency trading relies on fundamentals, you also receive information on related indexes and commodities. You can see an example of the technical analyzer in Figure 2. The analysis is updated and listed on the top of the window. If any of the listed items interest you, just click on it and the details and the chart will be displayed in the lower half of the window. Let’s say you are interested in the analysis titled “Gbp/Usd intraday: The upside prevails.” If you click on this story, you will see key support and resistance level data, the pivot point, suggested entry price, suggested target levels, and a short comment on the direction of the currency pair. The analysis is supported with a chart.

Figure 2: technical analyzer. This list is updated constantly, and if any of the listed stories interest you, all you have to do is click on it and you’ll see more details and a chart displayed in the bottom half of the window.
You also receive alerts for various indexes, bonds, currency pairs, and commodities. These alerts are based on some basic indicators such as moving averages, Bollinger bands, and the relative strength index (Rsi). You can also get information on candlestick patterns when they appear on charts. However, the charts don’t show where the candlestick pattern appeared.
The SSI
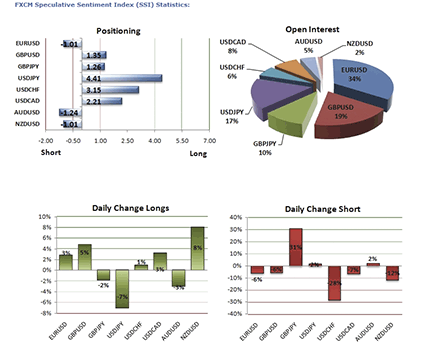
The speculative sentiment index (Ssi), a proprietary indicator, gets updated twice daily. It gives you an idea of the ratio of buyers to sellers. For example, you could see a headline stating that the Usd/Jpy declines, 71% of traders are long, and the ratio of long to short positions stands at 4.17. If you click on this headline, you will see a visual display of all the statistics, the intraday highlights, and the Ssi details of about eight currency pairs (Figure 3).
The graphical display of the Ssi was clear and easy to understand. You can easily see the ratio of long versus short positions, the open interest, the daily change in long positions, and the daily change in short positions. In addition, you see the intraday highlight of the pair in question as well as the Ssi details of all eight pairs.

FIGURE 3: SPECULATIVE SENTIMENT INDEX (SSI). This indicator gives you an idea of where traders are. You can easily see the ratio of long versus short positions, open interest, and the daily change in long and short positions.
Trading course
Finally, under the forex trading signals tab is the trading course. The advantage of this course is that you can study at your own pace. If you need to ask questions, just click on the “Ask questions” link and it’ll take you to the forums where you can communicate with instructors. From there you can wander off into other sections of the forum to discuss just about anything related to currency trading. In addition to the lessons there are live webinars, homework assignments, and course documents.
There’s more
Bear in mind that the forex trading signals tab is just one among several. There are more, so you can imagine just how much information is available on this site.
With the exception of DailyFX Plus, which includes features available under the forex trading signals tab, most of the information is available for anyone browsing the website. I would recommend all traders visit DailyFX.com to get a dose of what the day holds for currency traders.