AT THE CLOSE
Points Of Force In Price And Time
Here’s a trading strategy based on the works of W.D. Gann. Would it work for you?
Traders are often told to “keep it simple.” But even if you do so, your trading can still suffer losses. Years of experience have shown me that to be precise, especially in short-term trading, you cannot afford to use a trading system with just three buttons: “Buy,” “Sell,” and “Panic.” If you are not lucky by nature you need to work, study the market, and learn constantly in order to succeed.
Here is a short-term aspect of my trading strategy, based on the writings of W.D. Gann. I follow daily and weekly trends, use Gann’s Master Charts, mathematics, and astrology. I also use a combination of tools to identify short-term trends in order to enter the market precisely before the daily trend unfolds. I will show you how to use price tools (swings, scale, angles, vectors, Fibonacci levels, square of 144, square of 9), time tools (fixed, variable and natural time levels, circle of 360), and astronomy factors. And finally, I will focus on price swings, natural and Fibonacci price levels, and market inertia using the May soybeans futures contract hourly chart from its low at 911 on February 4, 2010, as an example. However, you can apply these tools to any market.

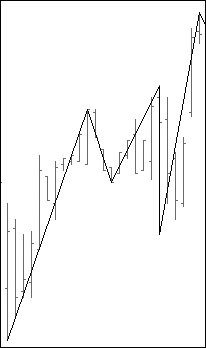
Figure 1: price swings. The swing starts when you have two consecutive bars with higher highs (upswings) or lower lows (downswing) and continues till a swing in the opposite direction unfolds.
The trading strategy in action
First, you draw a two-bar price swing (Figure 1). The swing starts when you have two consecutive bars with higher highs (upswing) or lower lows (downswing) and continues until a swing in the opposite direction unfolds. These swings will show you a simplified market structure.