INDICATORS
Variable Strategy
Using The Euro To Trade Gold
Reaching a critical price in one commodity often triggers an emotional response by investors in other commodities. Here’s a look at the relationship between a leading variable and a lagging one.
Reaching a critical price in one commodity often triggers an emotional response by investors in other commodities. Market participants quickly react to these price disruptions, and their response eventually trickles down to less-active momentum players. Once enough market participants begin jumping aboard, this pattern — with its basis in market sentiment — establishes a foothold.
This article focuses on the intraday activity of two commodity contracts: the leading variable and lagging variable, the first of which drives the price of the second. In order to demonstrate how these two variables function, I will use the euro, the official currency of the European Union (EU), as the contributory (leading) variable, and the gold futures contract as the response (lagging) variable.
The euro (EC) trades on the Globex, using the US dollar as its currency. It has a multiplier of 125,000 with increments of 0.0001 ($12.50), whereas the gold futures contract (GC) trades on the Nymex and has a contract size of $100 per troy ounce with a multiplier of 10. I ran this analysis by downloading the numbers for the continuous contracts [6E #F/GC #F] directly from Interactive Data.
Economic background
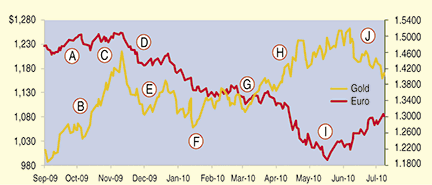
The fear of another “Greek-style” fiscal crisis spreading to other EU countries puts additional pressure on the euro, mostly over concerns about the solvency of its members. In reaction, central banks began turning off the tap in an effort to stem the flow of easy financing. This sudden shift to such a stringent monetary policy exerted a negative impact on its currency. The rapid depreciation of the euro (red line in Figure 1) can be seen in the double-axis line chart comparing the two futures contracts.

Figure 1: daily price movements of gold and euro. This double-line chart captures the daily price movements of the two commodities. The currency (euro) is the leading variable; its performance from 8:30 am to 10:00 am is applied to forecast the price of the GC (gold) futures contract between 10:00 am to 12 noon. The red line represents the euro’s progress, while the yellow line represents that of gold.