FOREX FOCUS
The Precious Metal Pauses
Does Gold Still Have Room To Run?
The futures volume open interest indicator will tell you.
Many investors are hesitant about investing in gold. Memories of the stratospheric and unexplained rise to the unchartered territory of the high $800s in January 1980, followed by several limit-down days, still haunt baby boomers, many of whom had never before witnessed such action in their entire investing lives. In three short months, gold plunged from its all-time high of $873 on January 21, 1980, to $453 on March 27, 1980, or a drop of 51.9%. But it didn’t stay there; the precious metal inched back up, reaching $729 on September 23, 1980, an encouraging gain of 60.9%.
Eventually, the rally petered out and gold dropped once again, touching $297.50 on June 21, 1982, or a loss of 59.2% in 21 months. By this time the luster of gold had worn off and investors had had it with the metal. But the question remained: Would gold ever go back up to its old highs?
A detailed look at gold
Someone made money during that rise in gold throughout the 1970s. Who? The heavy hitters with millions to play with, who are in touch with the supply and demand situation of gold on a daily basis — these traders generate enough trading volume to affect the open interest in gold futures, which then allows ordinary investors to keep track of them, albeit from a distance.
Volume is an easy concept to understand. It is the number of contracts traded during a particular period, be it daily, weekly, monthly, or annually. Price will move more on heavy volume than on light volume. When it comes to stocks, heavy volume on the buy side usually leads to higher prices in the future, and conversely, heavy volume on the sell side leads to lower prices. This is not the case with futures.
Stocks can be held for many years, perhaps even decades, because the ownership in businesses that stocks represent does not expire. Investors buy and sell stocks at their discretion at a time of their choosing.

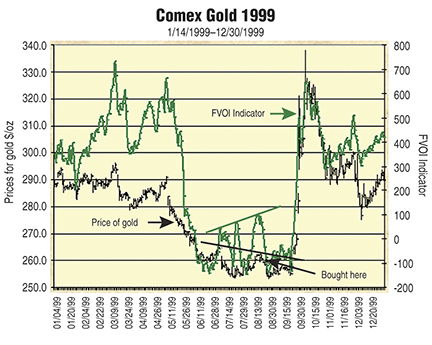
Figure 1: comex gold (1999). Between July and August, price eked out lower highs but FVOI showed higher ones. A long position was opened at $260 on August 18, 1999.