TRADING TECHNIQUES
Liberté! Fraternité!
How Good Is Your Data?
All data is equal — at least that’s what we think.
Is all data equal? If truth be told, I never gave it much thought. I have been using one vendor nearly exclusively for about 20 years. My fills are good enough. My closing prices seem to match what I see on television or find online. As long as the profits roll in, there has been no reason to question the data.
But then I was told by another vendor that my vendor’s data is off by just enough to generate a side income, through the slippage from actual price to the price I am presented. My curiosity was piqued, and so I decided to investigate. First, I set up a spreadsheet and compared the two vendors. To keep it simple, I considered only the past five years of data. My data experiment ran from June 30, 2005, to June 29, 2010.
Running experiments
I began by exporting the data for a single symbol from each software application to a comma-separated value (Csv) text file. The instrument I chose was the Russell 2000 index, which has different symbols in different software, like Rut, $Rut, and RU2000. I selected the Russell 2000 because of its high liquidity, ease of use, and it is something little guys like us can trade.
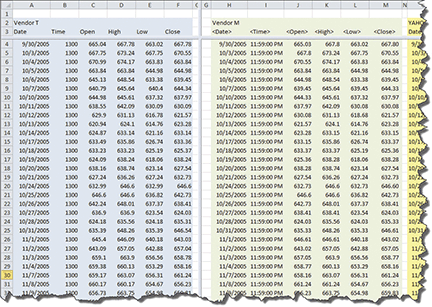
Figure 1 shows the beginning of the spreadsheet, with the data of the two vendors (T and M) in the columns. At first glance it appeared that everything was in order, with small discrepancies here and there. The differences in the data, where there is one, seem to be out in the hundredths place, like 600.01 vs. 600.02. That wouldn’t make much difference over time, with some errors to the positive and the negative. It seems like it should be a wash.
Next, I put columns in the spreadsheet to calculate the differences between the open, high, low, and close (Ohlc) of each vendor.

Figure 1: data comparison, vendor t vs. vendor m. The differences in the data seems to be in the hundredths. Will deviations this small affect your profits?