MONEY MANAGEMENT
Measuring Trading Performance
What Can You Expect, Mathematically?
Here’s a look at how mathematical expectation allows for an apples-to-apples comparison of trading systems or strategies regardless of type or style, as well as allowing the tracking of your own trading record.
A huge number of different trading systems and strategies are available in the market today, all with their own particular focus, style, time frame, and risk. The type of trading you engage in is a very personal matter and depends on many factors. The things that need to be considered include the market you are interested in; the amount of time you have to do the required research and to execute and maintain your trades; your preferred time frame (which could be from seconds to months); the style of trading whether technical, fundamental, news driven, or purely discretionary; and of course, the size of your trading capital, leverage, and risk tolerance.
Some of these questions are easy to answer and some require more thought. Whether you are new to trading and are still deciding on your preferred style and considering different strategies or systems, or you are an experienced trader looking to analyze your own trading results or new systems, mathematical expectation should prove to be a very useful tool to have in your statistical toolbox.
This article will define mathematical expectation and show how it allows for an apples-to-apples comparison of trading systems or strategies regardless of type or style, as well as allowing the tracking of your own trading record.
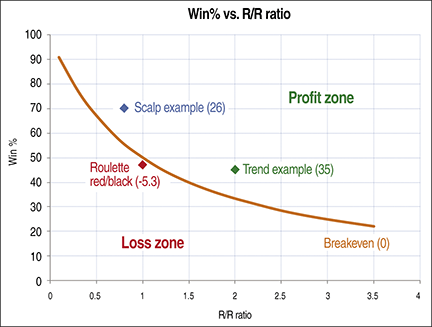
Figure 1: win% vs. r/r ratio. Here you see a comparison of the trend system (green), scalp system (blue), breakeven curve (orange), and roulette system red/black bet (red). A mathematical expectation of above 30 is generally considered to be good.