TRADING TECHNIQUES
Trading The Indexes
Empowering Traders With The Russell 2000
Ever thought of trading the Russell 2000? Here’s how retail traders could benefit from trading this index.
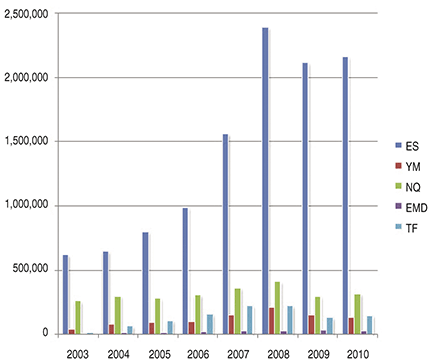
New traders are drawn to the emini Standard & Poor’s 500 like bees to honey. Go into any live trading room and chances are that the moderators are teaching traders to trade the emini S&P 500 because it has more liquidity than any other market. In Figure 1 the average annual volume is compared between the following emini indexes: emini S&P 500, Dow Jones Industrial Average (Djia), Nasdaq 100, S&P MidCap 400, and the Russell 2000. It would be a logical assumption that the emini S&P 500 moves more than any other market. After all, volume fuels the markets, and the emini S&P 500 has more volume than any of the other indexes. However, let us look closer to see if the emini S&P 500 leads in tick movement or dollar movement

Figure 1: average annual volume comparison. Here’s a comparison between the emini S&P 500 (ES), Dow (YM), NASDAQ 100 (NQ), S&P MidCap 400 (EMD), and the Russell 200 (TF). The ES definitely has more volume than any of the other indexes.
Figure 2 compares the average annual tick movement between the following emini indexes: S&P 500, Djia, Nasdaq 100, S&P MidCap 400, and the Russell 2000. As you can see, the emini S&P 500 is no longer the leader. In fact, during the eight-year analysis period, although the emini S&P 500 had the highest volume, it was the lowest in tick movement when compared to the other markets.
If volume fuels the markets and the emini S&P 500 has the most volume, why is it consistently lower in tick movement than any of the other markets? Since each market has different tick values, perhaps we need to compare the average dollar movement to find the answers.