Letters To The Editor
April 2011 Letters To The Editor
The editors of S&C invite readers to submit their opinions and information on subjects relating to technical analysis and this magazine. This column is our means of communication with our readers. Is there something you would like to know more (or less) about? Tell us about it. Without a source of new ideas and subjects coming from our readers, this magazine would not exist.
Address your correspondence to: Editor, Stocks & Commodities, 4757 California Ave. SW, Seattle, WA 98116-4499, or E-mail to editor@traders.com. All letters become the property of Technical Analysis, Inc. Letter-writers must include their full name and address for verification. Letters may be edited for length or clarity. The opinions expressed in this column do not necessarily represent those of the magazine. —Editor
READERS’ CHOICE AWARDS
 Editor,
Where can I find the results of your Readers’ Choice Awards, which I saw a reference to at your website?
—Ahmet
The 2011 Readers’ Choice Awards can be found in our 2011 Bonus Issue, which was mailed in February to all subscribers, and which will continue to be mailed out throughout the year to new subscribers. The Readers’ Choice Awards are based on the results of an online poll asking subscribers to vote for their favorite products and services.—Editor
KONDRATIEFF WAVE
 Editor,
I was reading “Kondratieff Wave Comeback” by Koos van der Merwe in the April 2010 S&C. I am new to the K-wave theory but I am fascinated by it. It is also my goal to achieve a better knowledge of Elliott wave theory.
I was wondering if the author could explain his approach to counting waves. I can count simple and straightforward waves, but when it comes to patterns like an inside day or three falling/rising candlestick pattern, I get stuck. I have been counting using pivot points (such as explained by Thomas DeMark), but I run into confusion when the waves get more complicated, as with extensions. This is especially true when it comes to corrective waves ABC.
—Hgs
Author Koos van der Merwe replies:
Thank you for your interest. You will find my latest article on K-waves in this issue, titled “Today’s K-Wave And Beyond.”
As for Elliott wave: I always look for simplicity. In fact, the February 2009 issue of S&C contained my article on Elliott wave theory, “Elliott Wave Theory, Simplified.” In this article (available from the store at Traders.com), I demonstrate that if you look for complicated waves, you will likely be wrong.
My advice is to always stick to the first rule of Elliott wave theory: The wave count must look right. I suggest checking out my February 2009 article for more on this.
MARKET INSTRUMENT FUNCTION
 Editor,
Thank you to authors Aleksey Gersimov and Alexander Ershov for sharing their article and ideas in “The Market Instrument Function” in the December 2010 S&C.
Here were some thoughts I came away with after reading the article:
- The idea that the way a price gets to its current level is important and often overlooked.
- I liked that a person only needs to know that the fundamental laws defining the market exist, not figure them out.
I won’t pretend that I understand all the complex math that their article displayed, but I did have a few questions for the authors:
- What is in their device A?
- Which charting platforms can their model be used with?
- Could the model be applied to other markets, including commodities and forex?
- Could this model be used for intraday charts?
—David Butcher
Authors Aleksey Gersimov and Alexander Ershov reply:
We appreciate your practical questions and hope our clarifications here and example forecasts are of interest to readers.
1. In regard to your question about device A: Our model presupposes that device A includes all the factors that influence price formation. These factors include fundamental economic laws; signals provided by trading systems; credit and tax cycles; natural cycles; and so on. The proposed model — which is constructed from an input signal, a device, and an output signal — is only a convenient visual image. In actuality, we are talking about greater things.
We act on the premise that any complex system should be studied as a whole. If you try to separate the complex system into several simple systems and study them separately, and then sum up the simple systems into the complex one, you end up with a completely different system. Thus, we can’t consider the laws that form the market separately. All the factors, which influence the prices, constantly interact and influence each other as well. The instrument function method makes it possible to analyze the market as a whole and not be concerned with what is the exact cause of each and every market action.
2. Regarding charting platforms: We used MetaStock for producing our final results.
3. In regard to applying this model to other markets such as commodities and forex: We applied our instrument function method to gold, oil, and the Crb index in practice, which we had success with. We haven’t yet applied it to the forex market, but we think the results will be positive there too, since we can find solutions for Etfs such as Fxe and Uup.
4. As to whether this model can be used for intraday charts: We have tried to find the answer to the integral equation:

which is written for the function ![]() and
and ![]() . Conversion to different time frames means using a different quantity of data points, which determine the functions
. Conversion to different time frames means using a different quantity of data points, which determine the functions ![]() and
and ![]() .
.
Of course, insofar as functions in different time frames are the same and differ from one another only in level of detail, the instrument function will be the same for any time frame, and we cannot glean any new information from small time frames. The picture of the future will be the same, but it will become overloaded with noise. However, when we change days to weeks, the amount of patter goes down sharply and the computational picture of the future becomes better for practical application (Figure 1).
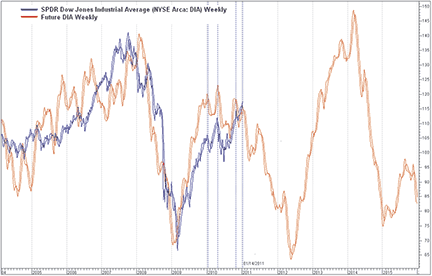
FIGURE 1: DIA five-year weekly FORECAST. Here are historical prices (blue) along with the projected movement of prices (red) approximately five years forward.
We can’t say why there is more noise in small time frames; it seems as though the cause is the randomness of intraday pricing. We simply observe that when we build the forecast based on intraday bars, the chart becomes overloaded with noise.
Thus, the market instrument function is of little use for revealing the finer structure of price movement. We feel the method is inefficient for forecasting in small time frames and impossible for intraday speculation. But this doesn’t mean that the market instrument function is useless for projecting market targets. For example, we can forecast price movement for the Dia for the next 10 years in a weekly time frame (Figure 2). We can see the following tendencies from the chart:
| January 2011 to June 2012: | Bearish market |
| June 2012 to January 2014: | Bullish market |
| February 2014 to March 2015: | Bearish market |
| March 2015 to February 2017: | Flat |
| March 2017 to May 2018: | Bearish market, with a deep market crisis portending |
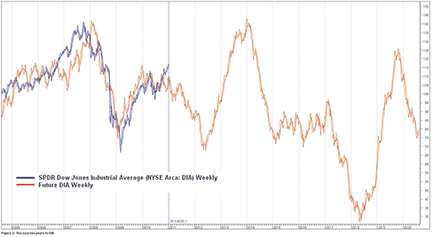
FIGURE 2: DIA 10-year weekly FORECAST. This chart updates the forecast from Figure 1 out to 10 years (till 2020).
Using the model to forecast long-term tendencies may be more profitable in comparison with intraday speculation, since using such a long-term forecast can make it possible to stay in step with the overall market direction and help you to avoid the most serious mistakes in timing. Having this type of information makes the market instrument function a powerful tool for planning and constructing an investment strategy.
Besides, this method makes it possible to use classical technical analysis not only for analyzing the past and present but also for analyzing the future. Figure 3 provides an example of a forecast for the future movement of such market indicators as the relative strength index (Rsi), moving average convergence/divergence (Macd), commodity channel index (Cci), and stochastics (Sto).
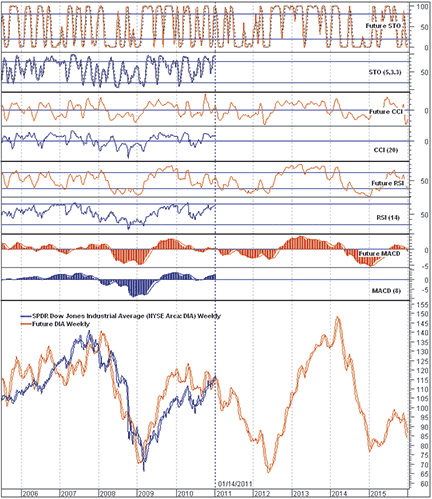
FIGURE 3: DIA five-year FORECAST FOR MACD, RSI, CCI, AND STO. The historical values for these indicators (blue curves) are shown along with the forecasted values of the indicators (red curves).
Finally, events can be late or take the lead over the forecast, but as a rule, they always observe the law, which is set by the market instrument function.
MARKET INSTRUMENT FUNCTION
In “The Market Instrument Function” in the December 2010 S&C, an error occurred in one of the charts on page 54. The keybox in the chart in Figure 2 should have read:

In addition, the author biography at the end of the article should have stated that coauthor Alexander Ershov has been studying the use of mathematical methods for weak signal reception as applied to stock market forecasting since 2005, not since the early 1990s.
—Aleksey Gersimov (avgerasimov@umail.ru)
—Alexander Ershov (amershov@umail.ru)
MEASURING TRADING SYSTEM PERFORMANCE
Editor,
I found the article by Stephen Massel in the March 2011 S&C (“What Can You Expect, Mathematically?”) to be very informative. However, I had problems with the calculation for the ME (mathematical expectation) result for the sample scalping system. I got a result of 33 for this calculation, rather than the 26 shown in the article. In addition, the point plotted on the chart seems to be off a bit. Did I misinterpret something in the article?
—Jack Brennan
Author Stephen Massel replies:
You are correct — the R/R ratio for the scalp system should have been 0.8 instead of 0.9, yielding an ME of 26 [70 x 0.8 - (100-70)]. With an R/R ratio of 0.9, it would indeed have an ME of 33. Thanks for pointing it out.
COVERED CALL WRITING
Editor,
On page 13 of the February 2011 article, “Investment Vs. Trading In Covered Call Writing,” author Jay Kaeppel writes, “If the stock price is below the strike price for a given call option at expiration, that option will be exercised and the option seller called upon to deliver 100 shares of the underlying stock at the strike price.”
However, shouldn’t this have read, “If the stock price is above the strike price for a given call option at expiration, that option will be exercised and the option seller called upon to deliver 100 shares of the underlying stock at the strike price”?
—David Carpenter
You are correct — it should have read “above.” Thank you for bringing this to our attention.—Editor
Editor,
The article “Investment Vs. Trading In Covered Call Writing” by Jay Kaeppel in the February 2011 S&C was interesting and thorough, but Kaeppel causes some confusion in his comment in step 3 at the bottom of page 20 when he writes, “If an option expires, it will do so either in-the-money (stock price below the strike price) or out-of-the-money (stock price above the strike price).”
According to Investopedia.com, the definition of “in-the-money” is when the option’s strike price is below the market price of the underlying asset for a call option, not above. By the same token, “out-of-the-money” is when the option’s strike price is above the market price of the underlying, not below.
But while I’m writing, let me say that the articles in S&C are always thought-provoking, challenging, and quite informative.
—Jim Kimes
You, too, are correct. Thank you for pointing out these errors.—Editor
CALCULATION OF FVOI
Editor,
In my February 2011 article “Does Gold Still Have Room to Run?” in S&C, several errors appeared as follows:
- The first sentence of the third bulleted point on page 23, second column, should have read: “When prices are falling but open interest is rising, add the change in open interest to today’s volume.”
- The first sentence of the fourth bulleted point on page 23, second column, should have read: “When both price and open interest are falling, subtract the absolute value of the change in open interest from today’s volume to emphasize that the current trend down may be ending and an uptrend may be emerging.”
- The equation for the Fvoi indicator (futures volume open interest) was missing a set of parentheses. The equation should have read:

which also can be written as:
Thus, the entire expression (Vi + (OIi - OIi-1) should be enclosed in parentheses, so that the whole result gets multiplied by ((Pi - Pi-1) / |Pi - Pi-1|)).
Otherwise, all charts and analyses remain the same.
—Teresa Fernandez (teresa.fernandez.wg72@wharton.upenn.edu)
JANUARY 2011 EXCEL TRADERS’ TIP
Editor,
In the January 2011 Traders’ Tip for Excel, an error occurred in the formula for column Q. Thus, I am providing a replacement spreadsheet file for “Combining RSI with RSI.xls.”
As programmers and manufacturers both know, there is nothing like a real, live user to find the bugs in something you have built. My thanks to the readers who tried large smoothing numbers and let me know that something was slightly off on the charts in the original version of the spreadsheet.
—Ronald McAllister (rpmaca_sprynet.com)
Subscribers can download the corrected spreadsheet file, “Combining RSI with RSI.xls,” from our website at www.traders.com in the January 2011 Traders’ Tips area at https://www.traders.com/Documentation/FEEDbk_docs/2011/01/TradersTips.html (or use the search engine at Traders.com and type in “combining rsi with rsi”).—Editor