CANDLESTICK CORNER
Candlesticks, Statistically
Investment Candles
Which candlesticks work best as reversal or continuation patterns? Find out here.
Investment-grade candlesticks work as reversal or continuation patterns at least two-thirds of the time (66%), and they are plentiful. By “plentiful,” I mean that I sorted a list of 103 candlestick patterns by how often they appeared in the Standard & Poor’s 500 from August 1996 to August 2006. I split the list and discarded the rare ones. That left just 13 candle types, which I describe here.
Configuration and definition
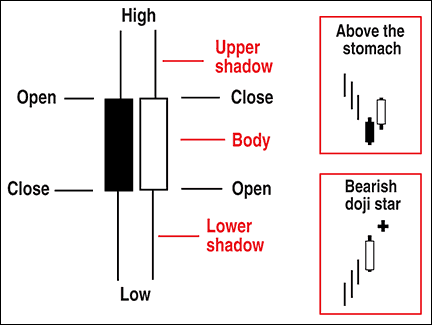
Before I discuss the performers, let’s review the configuration. Figure 1 shows two candlesticks, one black and the other white. The price bar’s high is at the top of the candle, and the low is at the bottom. Between those two extremes are the opening and closing prices, the order of which determines the candle body’s shade. The thin bars at either end are the shadows or wicks, with a body sandwiched in between. A candle need not have a shadow, and the body can be a flat line as in a four-price doji. In those situations, all four prices are the same.

Figure 1: basic candlestick configuration, above the stomach and bearish doji. Here you see the configuration of a candlestick, a reversal pattern that appears in a short-term downtrend referred to as “above the stomach” and a bearish doji star, which is considered to be a bearish reversal but doesn’t act that way 69% of the time.